
India Foundation organised the 95th India Foundation Dialogue on 10 May, 2024. The session on “India’s Nuclear Deterrence: Need for Doctrinal Change?” was addressed by Air Marshal Rajesh Kumar, Former C-in-C, Strategic Forces Command of India and chaired by Vice Adm Shekhar Sinha, Member, Board of Trustees, India Foundation.
Interaction with Amb Indramani Pandey
India Foundation hosted an interaction with Amb Indramani Pandey, Secretary General, BIMSTEC, on 10 May, 2024 in New Delhi.
Interaction with Dr Ram Madhav
India Foundation hosted an interaction for spirited youngsters active in the public and policy domain, with Dr Ram Madhav, President, India Foundation, on 09 May, 2024. The interaction included deliberations on various social and cultural issues, and a need to address them from an innovative, futuristic perspective.
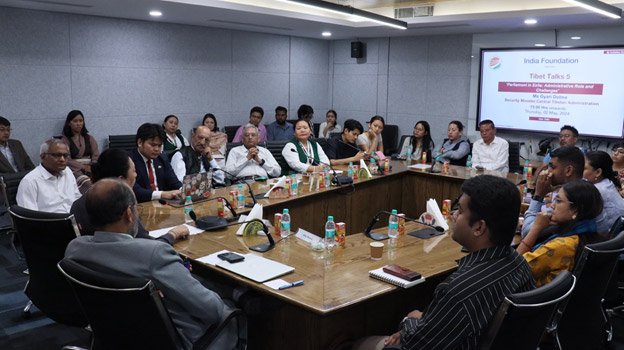
Tibet Talks – 5 – Parliament in Exile: Administrative Role and Challenges

India Foundation organised the fifth session of the Round-Table Discussions in the ongoing “Tibet Talks” series. The topic for this session was “Parliament in Exile: Administrative Role and Challenges”. The session was addressed by Ms Gyari Dolma, Security Minister of the Central Tibetan Administration (CTA), Dharamsala. The Round-Table Discussion took place on 2 May 2024 (Thursday) at the India Foundation office, with the session chaired by Capt Alok Bansal, Director, India Foundation.
The speaker highlighted the unique democratic structure of the Tibetan exile Administration, contrasting it with India’s system. In the Tibetan democratic structure, there are no political parties, and candidates are nominated and elected directly by the people. The speaker explained the dual role of parliament members, balancing both ruling and opposition roles.
The speech then delved into the history of Tibetan democracy, mentioning the influence of Indian democracy on the Dalai Lama and the establishment of the Tibetan Parliament in exile in 1960. It discussed the challenges of holding elections for Tibetans in exile and explained the composition of the Tibetan Parliament, with representatives from each of the three traditional provinces of Tibet. The speaker highlighted the role of women in the Tibetan-Exile parliament with 2 out of 10 seats from each province reserved for women since 1964 and expressed pride in stating that today there are more than 2 women from each province on their merits and not gender. The role of clergy in the parliament was also highlighted, with a discussion on the debates surrounding their representation. The talk moved on to discuss the administrative role of the Tibetan Parliament in exile, describing it as powerful within its democratic setup. The parliament plays a significant role in formulating policies, including foreign policy, with input from the public and debate among members. The Round-Table Discussion was attended by the young Tibetan diaspora in India, Former Diplomats, Entrepreneurs, Indian scholars, and the India Foundation team.
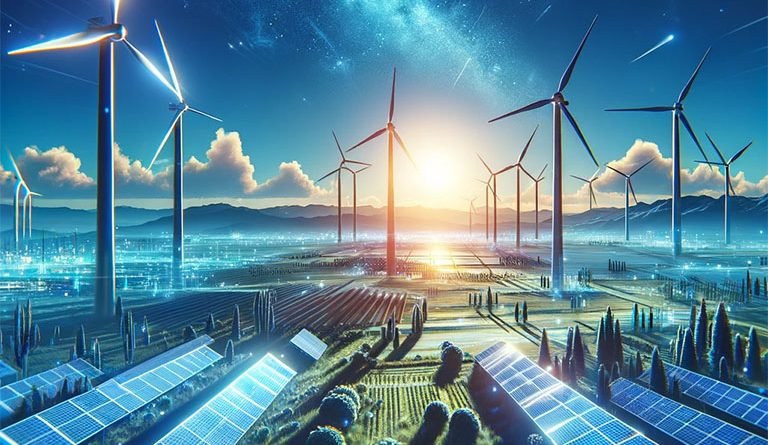
Renewable Energy Expansion and Decarbonisation: Moving Towards Net-Zero Emissions
Introduction
Bharat’s electricity sector is set for substantial growth and diversification. Bharat has set several targets for energy transition, security, and access, with specific timelines. As a part of the Nationally Determined Contributions (NDCs) submitted to the UNFCCC, India aims to increase the share of installed capacity for electric power derived from non-fossil fuel sources to 50% by 2030. Additionally, Bharat has set a goal to achieve net-zero emissions by 2070[1] and is on track to meet this target[2].
Under the leadership of Prime Minister Narendra Modi, the Government of India (GoI) has initiated an integrated energy assessment to support Bharat’s ambition of providing affordable electricity and clean cooking to everyone, ensuring energy security, and transitioning to renewable energy in a cost-efficient and sustainable manner. The GoI has undertaken progressive and ambitious policies and implementation efforts to electrify all sectors of the economy and provide green electricity. These policies and implementation efforts pave the way for Bharat to ensure energy security, transition, and universal and affordable energy access. The Prime Minister’s Office and the NITI Aayog, in collaboration with various central and state ministries and departments, work collaboratively to set a roadmap towards achieving these shared goals.
This paper highlights the progress made in the two terms of the Modi led NDA government to ensure Bharat’s energy security, energy transition, and universal and affordable energy access. The paper reviews the progress made regarding the push for renewable energy and decarbonisation to achieve these three policy objectives.
Overall Progress
According to the GoI sources[3], Bharat has added around 109 GW of RE capacity (excluding large hydro) during the last 10 years. Compared to capacity as of January 1, 2014, it reached over four times the total RE capacity, 31 times solar, and 2.2 times wind during the last 10 years. Bharat has also made significant progress in increasing access to electricity over the past decade. Almost all households in India now have access to electricity, and the distribution network has been strengthened throughout the country.
Projections from the 20th Electric Power Survey (EPS)[4] indicate a total installed capacity of 777.14 GW by 2029-30, with significant contributions from solar (292.56 GW), wind (99.85 GW), hydro (99.89 GW), small hydro (5.3 GW), and biomass (14.5 GW). These non-fossil fuel sources are expected to account for over 50% of the total installed capacity and contribute around 44% of the gross electricity generation during 2029-30[5] indicating Bharat’s steadfast commitment to a more sustainable energy landscape.
Renewable Energy Expansion and Decarbonisation Scorecard
Bharat aims to reduce its GDP emission intensity by 45% by 2030.[6] Currently, thermal power plants, which produce over 50% of Bharat’s total electricity output, account for one-third of the total GHG emissions.[7] As Bharat strives to meet its renewable energy expansion and decarbonisation goals, the electricity sector has embraced a diversification strategy by transitioning to cleaner energy sources such as solar, wind, bio, hydro, and atomic power.
State-nodal agencies in Bharat have gained significant expertise in renewable energy initiatives over the years. To facilitate mutual learning and the exchange of best practices, the Ministry of New and Renewable Energy (MNRE) established the Association of Renewable Energy Agencies of States (AREAS). The association comprises three standing committees: Technology and Resource Assessment, Policy and Finance, and IT. Policy initiatives like production-linked incentives and domestic content requirements will boost domestic manufacturing. Innovative regulatory support has addressed investment and counterparty risks and spurred demand.[8] At the same time, record-low solar tariffs and long-term power purchase agreements continue to draw billions of dollars in investment.[9]
Policies and programmes to ramp up renewable energy and decarbonisation solutions that have been launched and implemented since 2014 are as follows:
- Electricity (Rights of Consumers) Amendment Rules, 2023:
- Electricity (Late Payment Surcharge and Related Matters) Rules, 2022:
- Ujwal DISCOM Assurance Yojana (UDAY), 2015:
- Revamped Distribution Sector Scheme (RDSS), 2021:
- Green Energy Open Access Rules, 2022:
- Green Credit Programme, 2023, and Energy Conservation (Amendment) Act, 2022:
- Financial incentives for power sector reform.
Wind Energy
Bharat has made great strides in increasing its wind power capacity. As of June 2023, wind energy accounted for 34% of the total installed power generation capacity from renewable energy sources[10]. India now ranks as the fourth-largest market for onshore wind installations globally, with a 5% contribution to the world’s total onshore wind installations[11]. This sector has also generated approximately 50,000 jobs and hosts about 10% of the world’s wind turbine component factories[12].
Bharat has a significant potential for both onshore and offshore wind energy. According to the India Energy Security Scenarios (IESS) 2047, wind energy is expected to contribute about 22.16 million metric tonnes of oil equivalent (Mtoe) to Bharat’s total energy supply by 2032, up from 5.9 Mtoe in 2022[13]. The GoI has introduced policies to establish hybrid plants combining offshore and solar wind technologies to promote renewable energy.
Policies and programmes that have been launched and implemented to ramp up wind energy are as follows:
- National Offshore Wind Energy Policy, 2015.
- National Wind and Solar Hybrid Policy, 2018.
Solar Energy
Bharat has made significant progress in solar energy in the past five years, positioning itself as a global leader. As of 2023, solar energy constitutes the largest portion (54%) of India’s total renewable energy capacity. Bharat ranks fourth worldwide in photovoltaic (PV) deployment, with its solar capacity growing by around 200%, from about 21.5 GW in 2018 to approximately 64.3 GW in March 2023[14]. Bharat intends to derive 50% of its electricity capacity from non-fossil fuel sources by 2030, and solar energy will play a major role in achieving this. India’s solar potential is about 750 GW, which could generate 3.2 million jobs and greatly benefit the economy[15]. Recent policy measures, such as production-linked incentives and regulatory support, have spurred domestic manufacturing, addressed risks, and boosted demand.
Through the International Solar Alliance (ISA)[16], the GoI fosters global collaboration to accelerate grid interconnectivity, mobilise investment, and support deployment through capacity-building.11 Bharat must continue to engage global partners and emerge as a key contributor to driving and leading innovation in solar energy.
Domestic Solar Manufacturing
Bharat has also recently made tremendous progress in expanding its domestic solar manufacturing capabilities. Its potential for manufacturing photovoltaic (PV) modules doubled between 2020 and 2023. Bharat is expected to see a fourfold increase in its solar module manufacturing capacity by 2025 compared to 2021[17]. Furthermore, projections indicate that Bharat will achieve self-sufficiency in meeting the demand for PV modules by 2026, thanks to a projected manufacturing capacity of 110 GW[18]. Some of Bharat’s major players in the PV manufacturing industry include Waaree, Adani Solar, and Vikram Solar.
Several policies and programmes to ramp up solar energy that have been launched and implemented in the two terms of the Modi government are as follows:
- Pradhan Mantri Kisan Urja Suraksha evam Utthaan Mahabhiyan (PM KUSUM), 2019.
- GoI had offered financial incentives to support the manufacturing of solar panels.
- PM Solar Rooftop Scheme 2024.
Green Hydrogen
Green hydrogen (GH2) energy is a new development in Bharat. Green hydrogen is produced using renewable energy sources such as solar, wind, or biomass. Bharat consumes about 5 million metric tonnes (MMT)[19] of hydrogen annually, most of which is produced using fossil fuels like natural gas and naphtha. The demand for hydrogen mainly comes from the industrial sector, which uses it for petroleum refining, fertiliser production, methanol, and metal production.
Green hydrogen can potentially provide low-carbon and self-sufficient economic pathways for Bharat. The country has ample renewable resources, particularly solar and wind energy, highlighting the promising potential for green hydrogen growth. The GoI is increasingly focusing on this sector, and the National Green Hydrogen Mission was launched in 2021 to make Bharat a global hub for producing, using, and exporting green hydrogen. The efforts under this mission are expected to create around six lakh jobs by 2030[20]. NITI Aayog has prepared a comprehensive roadmap to guide the country’s GH2 strategy and enhance private sector investment[21].
Several policies and programmes to ramp up green hydrogen that have been launched and implemented in the past decade are as follows:
- National Green Hydrogen Mission, 2023.
- Green Hydrogen Standards for India 2023.
- GoI has offered financial incentives to support the manufacturing of electrolyzers.
Bioenergy
Bioenergy is a type of renewable energy generated from biomass and feedstocks. These include agricultural residues, forestry residues, animal waste, and organic municipal solid waste. As of 2023, bioenergy (biomass power and co-generation) accounts for 2.5% of the total installed energy capacity and 6% of the renewable energy mix[22]. In Bharat, approximately 32% of the country’s primary energy comes from biomass, and over 70% of the population relies on it for their energy needs[23]. The bioenergy power generation capacity currently stands at around 10 GW[24], with over 800 biomass power, bagasse cogeneration, and non-bagasse cogeneration projects established. According to the India Energy Security Scenarios (IESS) by the NITI Ayoog, bioenergy is projected to contribute around 29 terawatt hours (TWh) to the electricity supply in 2047.
At the central level, the National Bioenergy Programme and National Policy on Bio-Fuels are the major policies that the Ministry of New and Renewable Energy implements to boost bioenergy production and achieve ethanol blending targets in gasoline. In addition to these policies, a range of additional initiatives have been undertaken by the central government to support the development of BioCNG plants.[25]
Policies and programmes to ramp up bioenergy solutions that have been launched and implemented are as follows:
- National Bioenergy Programme, 2022.
- (Amended) National Policy on Bio-Fuels, 2022.
- Sustainable Alternative Towards Affordable Transportation (SATAT) initiative aims to boost the uptake of compressed biogas (CBG).
- Galvanising Organic Bio-Agro Resources Dhan (GOBARdhan).
Storage Solutions
Energy storage technologies have become increasingly important in Bharat, primarily due to the growing focus on integrating renewable energy into the national energy mix. The expansion of renewable energy sources such as solar and wind presents the challenge of efficiently managing grid stability as they are intermittent. Energy storage plays a crucial role in optimising energy systems by enabling the storage of electricity for later use. Energy storage technologies, including pumped storage hydropower (PSH), and batteries, have become crucial to ensuring a reliable and resilient energy grid. This technology serves various applications, such as grid-level balancing for renewables, electronics, behind-the-metre (BTM) power backup inverters, and supporting the EV sector.
Various energy storage options, such as batteries and PSH plants, are available for commercial use. Additionally, emerging technologies such as flywheels, supercapacitors, and hydrogen offer promising potential. Currently, Bharat has a total energy storage capacity of 4745.60 MW from PSH projects and 39.12 MWh from battery energy storage systems[26]. In 2018[27], the demand for energy storage was 23 GWh, but it is expected to grow exponentially. The energy storage market in Bharat has a combined potential of 190 GWh during 2019-25[28], driven by renewable energy integration, the fast response ancillary services (FRAS) market, and transmission and distribution deferral. The electric vehicle (EV) industry will consume more than 36 GWh of batteries by 2025[29].
Boosting Domestic Manufacturing of Batteries
A domestic battery manufacturing ecosystem with elements like a robust supply chain of cells will be crucial for Bharat to gain an edge in mobility, grid energy storage, and consumer electronics. This will help reduce import costs of lithium-ion cells, which have increased sevenfold between 2014 and 2020, safeguard against potential supply shocks, and create new jobs. Further, there are opportunities for private players to invest in this sector through arrangements like government partnerships, which enable risk-sharing. The government has already started providing incentives for manufacturers through the PLI scheme approved in 2021.13
Policies and programmes to ramp up energy storage solutions that have been launched and implemented are as follows:
- National Energy Storage Mission: In 2018.
- Battery Waste Management Rules in 2022.
- National Programme on Advanced Chemistry Cell (ACC) Battery Storage.
- National Mission on Transformative Mobility and Battery Storage.
- National Mission on Transformative Mobility and Battery Storage.
- National Mission for Enhanced Energy Efficiency, 2021.
- GoI has offered financial incentives to support the manufacturing of solar batteries and related equipment.
Emerging Technologies
New and upcoming technologies in the energy sector are providing exciting opportunities for sustainable and eco-friendly energy sources. The Ministry of New and Renewable Energy (MNRE) is currently focusing on four new technologies—ocean energy, geothermal energy, hydrogen energy, and energy storage—to promote research and industrial development in Bharat. Progress on green hydrogen and storage technologies has been covered above in this paper. Ocean energy and geothermal energy are still in the early stages of development and are largely focused on exploration. Geothermal energy sources are sustainable and offer a consistent source of clean energy by tapping into the earth’s core heat, while ocean energy sources use the power of waves, tides, and temperature differences to generate electricity.
Negative Emission Technologies
Negative emission technologies (NETs) refer to innovative approaches and technologies that actively remove greenhouse gases—usually carbon dioxide—from the atmosphere. The process is referred to as carbon dioxide removal (CDR) if it involves removing carbon dioxide, or more broadly, as greenhouse gas removal (GGR) if it involves removing gases other than CO2. CDR approaches involve capturing and storing CO2 or converting it into useful products, such as via afforestation and reforestation, soil carbon sequestration, bioenergy with carbon capture and storage (BECCS), and direct air capture and carbon capture, utilisation, and storage (CCUS). NETs have the potential to play a crucial role in decarbonising energy-intensive sectors such as electricity, mining, and steel. CCUS is presently the only recognised technology capable of reducing carbon emissions in CO2-intensive and hard-to-electrify sectors such as heavy industries, including steel, cement, oil & gas, petrochemicals & chemicals, and fertilisers.[30] Bharat plans to capture 750 mtpa of CO2 via CCUS technologies by 2050, which makes up 30% of all capturable emissions of 2400 mtpa.[31] Thus, there is a growing interest in negative emission technologies, mainly CCUS, in Bharat as part of the nation’s efforts to combat climate change and decrease greenhouse gas emissions in the energy sector.[32] One of Bharat’s first CCUS projects is being led by Indian Oil Corporation Ltd. (IOCL) and Oil and Natural Gas Corporation (ONGC), who are setting up Bharat’s first large-scale carbon capture project in Gujarat.[33] The project involves capturing CO2 at the IOCL refinery, compressing it, and transporting it through pipelines to ONGC’s oil fields for enhanced oil recovery (EOR), leading to increased oil production while ensuring the permanent storage of CO2.
Policies for NETs are still in their early development stages; however, several guiding frameworks can be leveraged to support Bharat’s decarbonisation efforts:
- Draft 2030 Roadmap for Carbon Capture Utilisation and Storage (CCUS) for Upstream E&P Companies, 2022[34]:
- CCUS Policy Framework and its Deployment Mechanism in India, 2021.[35]
Conclusion
The enabling policies and implementation support for renewable energy expansion and decarbonisation efforts over the last decade have been unprecedented in terms of their scale, speed, and reach. Overall, the Modi led NDA government scores an A+ scorecard. As it plans for its third term, reforms to improve the financial health of electricity distribution companies, a continued push for domestic manufacturing of renewable energy components, enhancing access to green finance, enabling policies for scaling up private sector investments, and strengthening the capacity of government functionaries should remain priorities to realise the aims and objectives of Viksit Bharat.
Author Brief Bio: Jagjeet Singh Sareen is a Partner at Dalberg Advisors, a global strategy advisor firm. He has previously served as an Assistant Director-General of the International Solar Alliance and a Senior Policy Officer at the World Bank Group.
References:
[1] Ministry of Environment, Forests and Climate Change, Net zero emissions target, 2023
[2] Cabinet, Cabinet approves India’s Updated Nationally Determined Contribution to be communicated to the United Nations Framework Convention on Climate Change, 2022
[3] Ministry of New and Renewable Energy, 2024
[4] CEA, Central Electricity Authority, Report on optimal generation capacity mix for 2029-30, 2023
[5] CEA, Central Electricity Authority, Report on optimal generation capacity mix for 2029-30, 2023
[6] Cabinet, India now stands committed to reduce Emissions Intensity of its GDP by 45 percent by 2030, 2022
[7] ORF, Power Sector: Stumbling block in India’s net-zero journey, 2022
[8] CEEW, How India’s Solar and Wind Policies Enabled its Energy Transition, 2021
[9] IEEFA, Renewable energy investment surges in India; IEEFA, Capital Flows Underpinning India’s Energy Transformation, 2022
[10] Central Electricity Authority, Executive Summary on Power Sector, June 2023; Note: RES include Small Hydro Project, Biomass Power, Urban and Industrial Waste Power, Solar and Wind Energy
[11] Global Wind Energy Council, India Wind Energy Market Outlook 2022-2026, 2022
[12] National Institute of Wind Energy, India’s Wind Potential Atlas at 120m agl, 2019
[13] NITI Aayog, India Energy Security Scenarios (IESS) 2047, 2021
[14] Ministry of New & Renewable Energy, Physical Progress, 2023; Ministry of New & Renewable Energy, Solar Energy, accessed July 2023; Ministry of New and Renewable Energy, Solar Energy capacity has nearly tripled in last 5 years from 21651 MW to 64380 MW, 2023
[15]Ministry of New & Renewable Energy, Solar Energy, accessed July 2023; CEEW, India’s Expanding Clean Energy Workforce, 2022
[16] Isolaralliance.org
[17] Ministry of Information and Broadcasting, Union Budget 2022-2023: India Embarks on a Solar Journey, 2022
[18] Cabinet, Cabinet approves Production Linked Incentive Scheme on ‘National programme on High Efficiency Solar PV Modules’ for achieving manufacturing capacity of Giga Watt (GW) scale in High Efficiency Solar PV Modules, 2022; Ministry of Power, Government allocates 39600 MW of domestic Solar PV module manufacturing capacity under PLI, 2023
[19] Ministry of New and Renewable Energy, National Green Hydrogen Mission, 2023
[20] Ministry of New and Renewable Energy, National Green Hydrogen Mission, 2023
[21] NITI Aayog, Harnessing Green Hydrogen, 2022
[22] Ministry of Power, Power Sector at a Glance ALL INDIA, 2023
[23] Ministry of New and Renewable Energy, Bio Energy, 2022
[24] Ministry of New and Renewable Energy, Bio Energy, 2022
[25] Press Information Bureau, Establishment of Bio-CNG plants, 2022
[26] Ministry of New and Renewable Energy, 64.54 billion units electricity produced from Wind Energy during April, 2022, 2023
[27] India Smart Grid Forum, Energy Storage System Roadmap for India: 2019-2032, 2019; India Energy Storage Alliance, India Stationary Behind-the-meter (BTM) Energy Storage & Railway Battery Market Overview 2021-30, 2022; Ministry of Power, National Electricity Plan (Draft), 2022
[28] India Smart Grid Forum, Energy Storage System Roadmap for India: 2019-2032, 2019
[29] India Smart Grid Forum, Energy Storage System Roadmap for India: 2019-2032, 2019
[30] NITI Aayog, CCUS Policy Framework and its Deployment Mechanism in India, 2021
[31] NITI Aayog, CCUS Policy Framework and its Deployment Mechanism in India, 2021
[32] NITI Aayog, CCUS Policy Framework and its Deployment Mechanism in India, 2021
[33] Ministry of Petroleum, Oil and Natural Gas, Draft 2030 Roadmap for Carbon Capture Utilization and Storage (CCUS) for Upstream E&P Companies, 2022
[34] Ministry of Petroleum, Oil and Natural Gas, Draft 2030 Roadmap for Carbon Capture Utilization and Storage (CCUS) for Upstream E&P Companies, 2022
[35] NITI Aayog, CCUS Policy Framework and its Deployment Mechanism in India, 2021
Emerging Trends in Indian Higher Education: Re-thinking Indian Academia to Rebuild Bharat
Artificial Intelligence and India: Navigating Strategic opportunities and Challenges
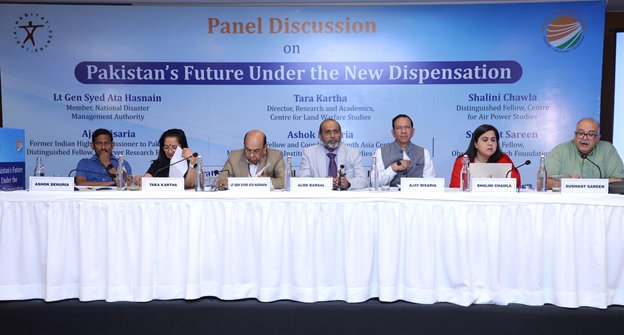
Panel Discussion on ‘Pakistan’s Future Under the New Dispensation’
Pakistan is grappling with several pressing issues, including ongoing economic difficulties and struggles in various sectors. Efforts to influence the situation in Afghanistan have led to escalating violence and heightened tensions. Moreover, ethnic fault lines within Pakistan are becoming more pronounced, further complicating the country’s internal dynamics.
To better understand “Pakistan’s Future Under the New Dispensation,” India Foundation and India Habitat Centre co-organized a panel discussion on April 23, 2024, at the India Habitat Centre in New Delhi. The event brought together distinguished experts to discuss the significant challenges facing Pakistan’s new ruling dispensation.
The panel comprised Mr. Sushant Sareen, Senior Fellow, Observer Research Foundation, Dr. Shalini Chawla, Distinguished Fellow, Centre for Air Power Studies, Mr. Ajay Bisaria, Former Indian High Commissioner to Pakistan and Distinguished Fellow, Observer Research Foundation, Lt. Gen. Syed Ata Hasnain, Member, National Disaster Management, Dr. Tara Kartha, Director of Research and Academics, Centre for Land Warfare Studies and Dr. Ashok Behuria, Senior Fellow and Coordinator, South Asia Centre, Manohar Parrikar Institute for Defence Studies and Analyses. Capt. Alok Bansal, Director, India Foundation, moderated the panel discussions.
The panellists engaged in a robust discussion on Pakistan’s challenges and potential opportunities for the future. They explored how the current leadership could navigate economic struggles, internal tensions, and external pressures. The panel also considered the implications for India and the broader region, highlighting the importance of regional stability and security.
They provided a comprehensive overview of Pakistan’s political environment, focusing on the interface between various institutions such as the army, judiciary, and government. As the discussion progressed, Pakistan’s economic circumstances and the challenges faced by the new government were examined in detail. They deliberated on Pakistan’s foreign policy in relation to its military and government, exploring how to navigate future challenges involving foreign players in the region.
The speakers’ discussions and presentations focused on radicalization, terrorism, and the role of non-state actors in Pakistan, as well as the current role of Pakistan’s military and its future trajectory. This was in the context of the ethnic fault lines within Pakistan and how they impact the country’s internal discourse.
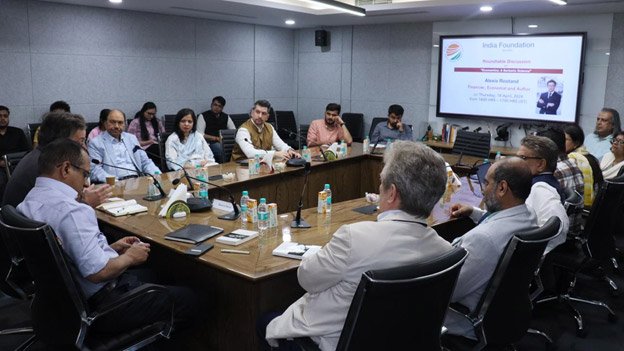
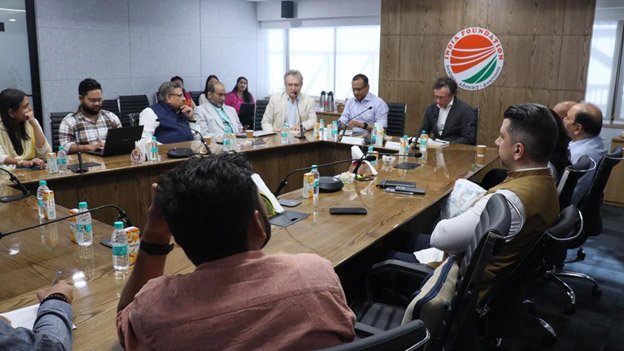
Roundtable discussion on “Economics: A Barbaric Science”
On 18 April 2024, India Foundation hosted a roundtable discussion on “Economics: A Barbaric Science”. The discussion was led by Mr Alexis Rostand, Author, economist & financier. Shri Shaurya Doval, Member, Governing Council, India Foundation, chaired the discussion. It was attended by scholars, subject experts & distinguished guests. Mr Alexis focused on going back to the sources of moral philosophy & to study history to make economics historically, philosophically, and morally aware science in the spirit of integral humanism. He suggested an integral approach to the economy, inspired by the concept of integral development.
Advertisement for Vacancies for an ICSSR supported Research Programme

Bharat on the Move: A Decade of Change and Progress

Has Bharat changed in the last ten years? Many would view the question as rhetorical, as Bharat has not only changed in a myriad of ways over the last decade, but the extent of change has been colossal. Let us examine the changes that have taken place in a few select sectors.
Over the last decade, Bharat’s economy has seen tremendous growth, despite the COVID-19 pandemic, which adversely impacted Bharat and the world during the two-year period from 2019 to 2021. According to the World GDP Ranking 2024 list, Bharat, with a GDP of USD 4.1 trillion, is now the fifth largest economy in the world, up from the tenth position in 2014, where Bharat’s GDP stood at USD 2.04 trillion. The inflation rate was also kept in check for the 2014-2024 decade, with inflation below 5 percent for most of the period. This stood in sharp contrast to the inflation levels during the 2004-2014 period, where inflation hovered for the most part near the 10 percent level. The per capita income also saw a significant rise from USD 1560 in 2014 to USD 2847 in 2024, an increase of 82.5 percent. This, in conjunction with low inflation rates, has substantially raised the standard of living of a vast segment of the population.
Defence preparedness is yet another success story. While Bharat is still heavily dependent on imports for a variety of upper-end defence equipment and is at present the largest arms importer in the world, concerted efforts have been made over the last decade to increase indigenous defence production and reduce dependence on imports through initiatives like the “Make in India” campaign and reforms in defence procurement policies. There is also a renewed focus on defence exports, which have touched USD 2.63 billion in the financial year 2023-2024. This represents a 32 percent increase over the previous year and is set to further increase in the coming years. The private sector is also contributing to Bharat’s growth story in the defence sector, and in conjunction with the Defence Public Sector Undertakings (DPSUs), is playing a crucial role in modernising and strengthening India’s defence capabilities. The last decade has also seen increased focus on the creation of defence infrastructure on India’s Northern and Eastern borders, with a large number of projects being completed by the Border Roads Organisation (BRO). Among these are the Sela Tunnel, constructed at an altitude of 13,000 feet; the Darbuk-Shyok-DBO Road, an all-weather strategic road in eastern Ladakh right up to the border; and the construction of the Zojila Tunnel at an altitude of 11,500 feet, which is part of the broader effort to improve connectivity to the border and correct the infrastructure imbalance with China.
Bharat’s foreign policy has also become more assertive, with a heightened focus on the country’s national interest, as seen by its stance on the Ukraine war, the Hamas-Israeli conflict, and its engagement in strategic partnerships with various countries, including the United States, Japan, Australia, and ASEAN. These partnerships are aimed at enhancing Bharat’s strategic and economic interests and promoting stability in the region. This assertiveness is also seen in Bharat’s response to cross-border terrorism emanating from Pakistan and also to Chinese aggressive behaviour in Eastern Ladakh and along the McMahon Line. A feature of Bharat’s nuanced change in its foreign policy is the role it seeks for itself on the global stage. This includes seeking membership in international forums such as the United Nations Security Council and actively participating in global initiatives on climate change, peacekeeping, and other issues. Another visible change in foreign policy is Bharat’s engagement with its diaspora, which it views as a strategic asset, contributing to economic growth, cultural exchange, and fostering closer ties with countries around the world. This has contributed greatly to India’s soft power and enhanced its image in the world, where Bharat is increasingly being viewed as the voice of the Global South.
Significant progress in the last decade has also been made in reforming the education sector, imparting skills to the population, digitalisation, focusing on upper-end technology, food and energy security, and also in many other fields. But perhaps the most profound change that has occurred is a mindset change that has imbued a new-found confidence and spirit among all sections and strata of society. This self-view of increasingly large segments of the population, as well as of their role in society and in nation-building, is reflected in a burgeoning start-up ecosystem, fuelled by a growing entrepreneurial spirit, supportive government policies, and increased venture capital investment. Young Bharatiyas are increasingly willing to take risks, innovate, and pursue their entrepreneurial dreams. There is a growing realisation, especially among the youth, that while the role of the government as a facilitator is essential for their economic progress and well being, it is their effort and struggle that will ultimately bear fruit. There is also an attitudinal change, where the people of Bharat are becoming increasingly conscious of their culture and heritage and are now proudly attached to their roots. Perhaps this is the reason why the construction of the Ram Temple at Ayodhya was so eagerly awaited, and why its inauguration satisfied a long-felt yearning and need. It was indeed a moment of spiritual awakening for the nation.
Bharat is today on the march, walking confidently on its unstoppable path to progress. This is perhaps the greatest achievement of the decade under the Prime Ministership of Shri Narendra Modi.
Author Brief Bio: Maj. Gen. Dhruv C. Katoch is Editor, India Foundation Journal and Director, India Foundation.
Economic Reforms Since 2014
ப ொருபென்னும் ப ொய்யொ விெக்கம் இருெறுக்கும் எண்ணிய தேயத்துச் பென்று
Wealth, the lamp unfailing, speeds to every land, Dispersing darkness at its lord’s command.” – Thirukural, Chapter 76, verse 753
For a country like Bharat, inclusive economic growth has been a significant part of its conscious. It is an indispensable part of the value system as enunciated in the four purushaarth – dharm, arth, kaam and moksh. Arth is the driver of all activities in the country, and when informed to all sections of the society, has the ability to transform the developmental outlook for it as well. This value system enabled Bharat to attain the second largest share (over 25%) in the global GDP for over 2,000 years1.
Post-independence, however, this agenda of robust and inclusive economic growth with central importance of arth, remained inconsistent. During the first two decades of independence, there have been wide variations in India’s growth rate with high frequency of negative growth rates2. This trend reflected in India’s poverty rates as well as the percentage of people in poverty increased from 47% in 1951 to 56% in 19743. Further, in 1969, major banks were nationalised with the objective to organise and improve efficiency of the banking system. While it helped in the expansion of banking services, lack of professionalism, high SLR and CRR rates combined with increasing Non-Performing Assets affected the banking health of the country.
The reforms of 1991 followed by structural changes to improve the economic health of country have been characterised with high economic growth rate, poverty reduction and significant improvement in the banking health. These structural changes helped India sail through the challenges posed by the Global Financial Crisis of 2008. However, the 2004-2014 era was characterised by high inflation rates, low fiscal discipline and increased revenue expenditures.
Starting 2014, a series of structural reforms have aided the country towards achieving its goal of economic prosperity for all. These reforms have been aligned with the broader objectives clearly articulated by the Govt. of India. It includes establishing $5 trillion economy by 2025 and a $7 trillion economy by 2030. The recently announced Viksit Bharat Sankalp by 2047 is an aim to present a holistic vision towards economic growth. The current review analyses the major economic reforms undertaken by the Govt. of India during the past decade under three broad themes, namely Macroeconomic Reforms, Banking Reforms and reforms towards Ease of Doing Business.
Macroeconomic Reforms
In 2014, the newly formed Modi government worked towards a stable macroeconomic policy. The purpose was to make the Indian economy resilient to external shocks post the Global Financial Crisis in 2008. This required effort towards reducing inflation, addressing jobless growth, enabling fiscal discipline and increasing forex reserves. One of the most prominent reforms is the make in India program.
Make in India
The policy is aimed to transform India into a global manufacturing hub. The purpose was to boost investment, foster innovation, enhance skill development, promote employment generation and build a manufacturing ecosystem in the country.
The Make in India initiative has led to a consistent increase in the net Foreign Direct Investment (FDI) inflows. This is evident in the graph 1 given below.
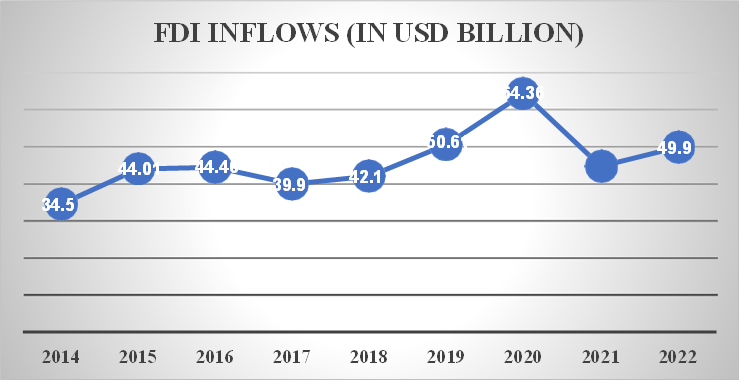
Graph 1:FDI in India (2014-2022) Source: World Bank
Make in India also has boosted employment generation. The Periodic Labour Force Survey (PLFS), published by the National Sample Survey Organisation (NSSO), has recorded a consistent decline in the unemployment rate of India since 2017 as evident in graph 2.
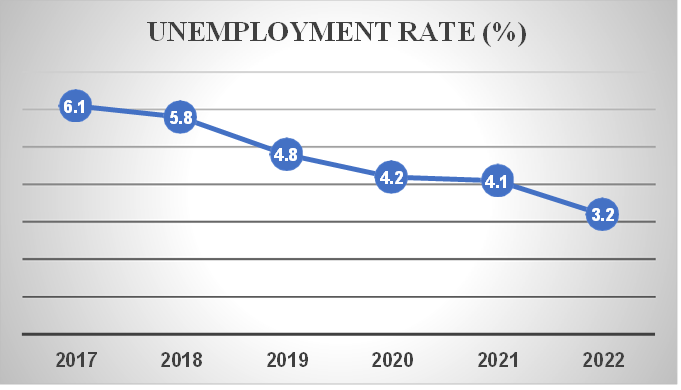
Graph 2: Unemployment Rate (%)
Source: Periodic Labour Force Survey Annual Report 2022-23
Make in India has acted as a catalyst to boost employment-oriented economic growth with a priority to produce many wealth creators. Make in India’s real success will come when share of manufacturing in the Indian economy increases from the present 17 percent to 35 percent, as envisioned. Make in India initiative got a further filip with the AtmaNirbhar Bharat Abhiyaan in 2020, that focused on developing a holistic strategy for future-proofing the economy from external shocks and external dependence. Focus was oriented towards providing liquidity to the MSMEs, incentivise agripreneurship and creating viable sources of income for the underprivileged4.
Fiscal Prudence
One of the most crucial aspects of the Modi government’s economic agenda has been a stable and prudent fiscal policy.
To maintain fiscal discipline and regulate government spending, Parliament of India enacted the Fiscal Responsibility and Budget Management (FRBM) Act, 2003. The Act mandated the government to maintain a fiscal deficit of less than 3%. Towards this end, the Govt. of India aims to limit public debt, borrowings and thereby, interest payments. India’s Gross Fiscal Deficit since 2013 has been demonstrated in graph 4. Here, it is visible that even though in the pandemic the fiscal deficit of the country tripled of the desired level, the country is enroute to reduce the deficit, indicating that the government is prudent in its spending.

Graph 3: Gross Fiscal Deficit (2013-2023) Source: RBI
Goods and Services Tax (GST)
One of the single biggest reforms undertaken by the Modi Government is the constitutional amendment that led to the adoption of the GST. Towards improving tax collection and enabling ease of tax payment, the GoI introduced the Goods and Services Tax (GST), a major structural change in the economy. The objective was to replace the prevailing complex and fragmented tax structure with a unified system that would simplify compliance, reduce tax cascading, and promote economic integration. It replaced the previous regime of multiplicity of taxes including VAT and service tax that were imposed on manufacturers.
Since its introduction in 2016 and after the initial hiccups, GST has now streamlined tax collection and has greatly improved tax compliance and collection.
Since its introduction, GST has enabled a decent increase in the indirect tax collection, surpassing more than INR 10,00,000 crores in 2020-21 (see graph 7).
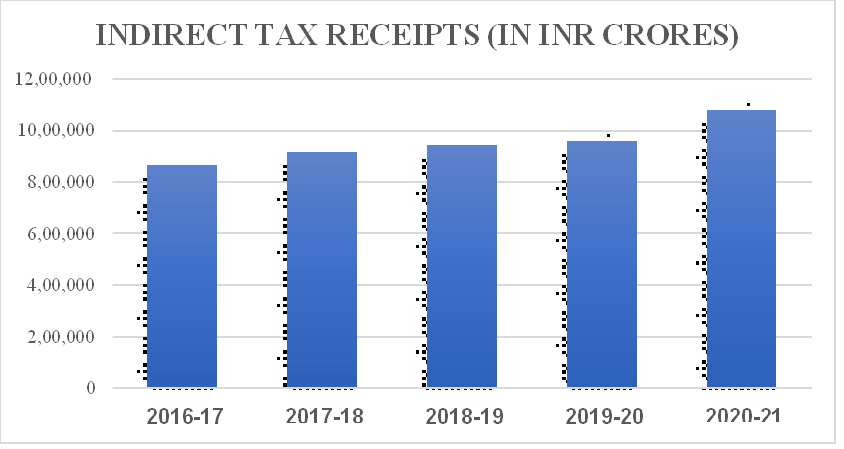
Graph 4: Indirect Tax Receipts (2016-2020) Source: Union Finance Accounts
As monthly GST collections top 1.78 lakh crore, for the fiscal year 2023-24, total GST collection topped 20 lakh crore and has witnessed double digit growth rates. This indicates a growing economy and a robust tax mechanism, enabling the government to plan its long term spending and capital expenditure.
Banking Reforms
In 2014, the banks of the country were grieving from an unprecedented and undisclosed crisis. With the collapse of the Leeman Brothers in 2008, a set of emergency measures were introduced to provide banks a leeway to prevent spillover of the global crisis. As a result, regulatory forbearance was introduced wherein restructured assets were no longer required to be classified as Non-Performing Assets (NPAs) and therefore did not require the levels of provisioning that NPAs attract. It provided a temporary relief for both the borrowers and the lenders, but its prolonged implementation resulted in piling up of undisclosed NPAs5.
Regulatory forbearance was coupled with the fact that banks were involved in increased risky lending since mid-2000s6. These borrowers when started to default were not displayed on the balance sheet of the banks owing to regulatory forbearance. Once the forbearance was lifted in 2014, the NPAs started to reflect on the balance of all banks. This fact is reflected in graph 8 that depicts the Gross NPAs of the SCBs. Its clear that GNPAs have increased till 2017-18 after which they witnessed a progressive decline, indicating dispersal of good loans by SCBs.
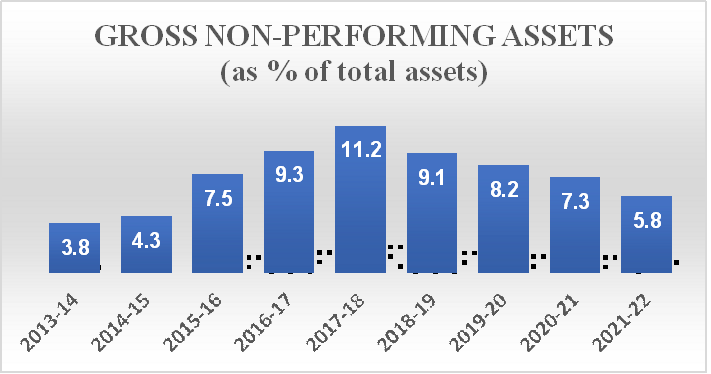
Graph 5: Gross Non-Performing Assets (GNPA) % of total assets of SCBs
Source: RBI
Government’s biggest reform push has been towards a clean up of the banking industry and concerted measures to reduce the GNPA.
Mission Indradhanush is one of the most comprehensive efforts to improve the health of Public Sector Banks (PSB). It covers all aspects of banking functions from appointment to a path towards addressing bad assets. It is meant to bring in transparency, professionalism and build robust balance sheets for banks. The several components of Mission Indradhanush include:
- Appointments – The separation of the post of CEO and MD to check excess concentration of
power and bring greater transparency in decision making.
- Creation of Banks Board Bureau – it has replaced the appointments board of PSBs and advises banks on fund raising; besides holding bad assets for the banks.
- Capitalisation – PSBs that were earlier struggling with bad assets and inadequate capital have now been well capitalised.
- De-stressing – Address pending issues in the infrastructure sector, which in turn reduces the problem of stressed assets for banks.
- Empowerment – providing greater autonomy for banks and more flexibility for hiring manpower that can allow PSBs to become competitive and efficient.
- Framework of accountability – key performance indicators for banks like NPA management, financial inclusion, diversification and growth, improve asset quality are all matrix that are now carefully monitored.
- Governance Reforms
Improved Legal Framework for Loan Recovery for Banks :
By enacting laws that allow banks to recover bad debts, the Government has aimed to address one of the thorniest issues for banks. amending laws like the Securitisation and Reconstruction of Financial Assets and Enforcement of Security Interest Act, 2002 (SARFAESI) have provided banks greater visibility in terms of acting against defaulters and bad loans. Such reform measures also go a long way in building investor confidence.
Revised Prompt Corrective Action Framework-
In 2017, with the idea to implement the Basel III norms, the RBI revised the Prompt
Economic Action Framework for Banks8. Capital, asset quality and profitability were the key areas for monitoring. The instruments of monitoring included CRAR, Net NPA Ratio, profitability and Return on Assets. It mandated banks to prepare a recovery plan in cases of emergency, manage credit and market risks. PCA framework is applicable to all the banks operating in the country including small banks and foreign banks. Inability to maintain the standards enunciated by the RBI, banks will be brought under the purview of PCA. The banking regulator can impose a host of restrictions on banks, ranging from restrictions related to the expansion of a branch, dividend and director’s remuneration and so on.
Asset Quality Review
While self-regulation is crucial, RBI has been actively engaging in the process of Asset Quality Review (AQR) initiated in 2015. RBI’s detailed assessment of the bank’s overall lending helps it to analyse the vulnerability of a bank to risky lending. It was through AQR, under which RBI has been continuously monitoring banks, that the rising level of NPAs were addressed. Besides the AQR, the RBI’s Strategic Debt Restructuring scheme have allowed banks to convert their loans to corporates and entities into major equity in the company. This is an innovative strategy that has protected banks from potential defaulters and added a new revenue stream.
Merger of Banks
Since 1991, fewer but stronger PSBs have been envisaged to create an efficient banking system capable to address the needs of a developing economy. These stronger PSBs were envisioned to act as catalysts of growth for the banking sector and provide a robust framework capable to withstand the headwinds of international economy. Merger of PSBs was reiterated by the Narasimhan Committee in 1998 and again the Leeladhar Committee in 2008. Beginning 2017, government has initiated a set of reforms for merger of banks in the country. Since then, the number of PSBs has been reduced to 12. Post these mergers, profitability of banks has consistently risen as presented in figure 1. Profitability figures are also a result of reduced NPAs, lower cost of operation, better geographical coverage and higher economies of scale.
National Asset Reconstruction Company Limited
To enable asset reconstruction, budget 2021-22 announced the formation of an ARC-AMC structure, comprising of two entities for aggregation and resolution of NPAs in the Banking Industry. It has been set up with a strategic initiative to clean up the legacy stressed assets with an exposure of Rs 500 crore and above in the Indian Banking system. It will provide assistance in consolidation of debt, currently fragmented across various lenders, thus leading to faster, single point decision making including through IBC processes, where applicable. It will incentivize quicker action on resolving stressed assets thereby helping in better value realization.
Indian banks, which are the backbone of the economy and are vital for stimulating a virtuous cycle of economic growth, have been witnessing reforms under the government’s 4R strategy, namely Recognition, Resolution, Recapitalisation and Reform.
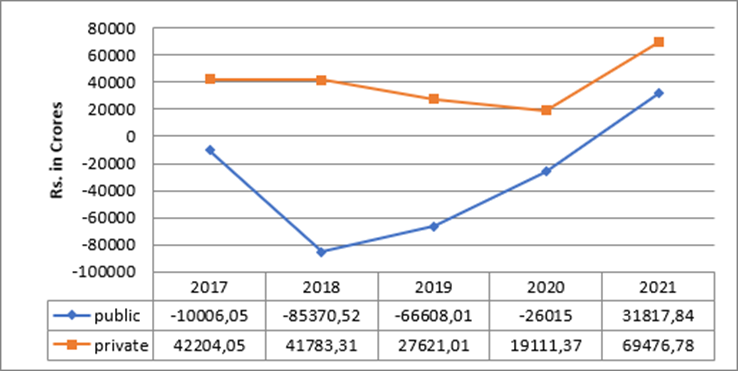
Fig. 1.: Net Profits of public and private sector banks in India Source: ResearchGate
Ease of Doing Business
For a country like India, setting up a business, operating it and maintaining it were considered to be a meticulous task. The fear of failure of a startup was persistent and continued to plague the development of wealth creators. To give the much-needed boost to entrepreneurship, creation of an investor-friendly ecosystem is crucial. This requirement was felt by the Modi government which worked towards improving ease of doing business. Improvement of India’s ranking in World Bank’s Ease of Doing Business became a priority.
GoI launched the PM MUDRA Yojana wherein loans of upto 10 lakh are provided to income generating micro enterprises engaged in manufacturing, trading and services sectors. More than 37.76 crore loans amounting to over Rs. 20.43 lakh crore have been disbursed since inception of the Scheme in April 2015. It has helped in generating 1.12 crore net additional employment during a period of nearly 3 years 9. India ranked 25 in terms of getting credit with the successful implementation of this scheme.
Real Estate (Regulation and Development) Act, 2016
For setting up any business easily, the process of getting construction permits needs to be streamlined. Recognising this gap, Parliament enacted the Real Estate (Regulation and Development) Act, 2016 that significantly helped reduce corruption in acquiring land, building construction and enabling physical operations of the business. Post this major reform, India’s rank improved significantly in this parameter to 27. RERA made it mandatory for builders to register their projects before the start of the project. It also seeks to address other issues like pricing, quality of construction, and other charges. While this has greatly improved ease of doing business, RERA has had a larger impact on improving the real estate sector by providing much-needed transparency.
The third key parameter associated with improving ease of doing business is continued access to electricity. Power reforms related to distribution and transmission have improved the health of state-owned Discoms, thereby ensuring electricity for businesses.
Implementation of the Deen Dayal Updhyay Gram Jyoti Yojana (DDUGJY) and SAUBHAGYA has allowed 100% electrification of rural households enabling them access to electricity and providing better opportunities.
Insolvency and Bankruptcy Code, 2016
Another key aspect of improving the business climate in the country to make it attractive for global investors was allowing easier exits to investors in case of unsuccessful ventures. The Insolvency and Bankruptcy Code (IBC) was enacted in 2016. It provides time-bound processes for insolvency resolution of companies and individuals by licensed Insolvency Professionals (IPs). The Code specifies similar insolvency resolution processes for companies and individuals, which will have to be completed within 180 days. The resolution process will involve negotiations between the debtor and creditors to draft a resolution plan, paving the way for a process-driven exit in a time-bound manner. IBC has significantly helped improve India’s ranking as it ranked 52 in Resolving Insolvency parameter.
IBS allows visibility to investors in case of unsuccessful business ventures. Easier exits give comfort to global investors to evaluate alternate investment opportunities.
Author Brief Bio: Gaurie Dwivedi is a senior journalist and author.
References:
- Economic Survey 2019-20, Chap 1: Wealth Creation – The Invisible Hand Supported by the Hand of Trust.
- https://data.worldbank.org/indicator/NY.GDP.MKTP.KD.ZG?end=1986&locations=IN&start=1961
- https://pdf.usaid.gov/pdf_docs/PNACR801.pdf
- https://prsindia.org/files/policy/policy_committee_reports/Aatma%20Nirbhar%20Scheme.pdf
- Economic Survey 2020-21. Chap 7: Regulatory Forbearance – An Emergency Medicine, Not Staple Diet!
- Economic Survey 2019-20, Chap 1: Wealth Creation – The Invisible Hand Supported by the Hand of Trust.
- https://www.rbi.org.in/commonperson/english/scripts/Notification.aspx?Id=2523
- https://pib.gov.in/PressReleaseIframePage.aspx?PRID=1882885
- https://www.ventureintelligence.com/Indian-Unicorn-Tracker.php
Bharat’s Videsh Niti Unleashed

In Bharat’s foreign policy, diplomacy and the military have become Siamese twins. The new mantra is 2+2 meetings between the External Affairs and Defence Ministers and their foreign counterparts.
Why does every nation, big and small, want to befriend Bharat? I have a simple answer. In international affairs, particularly when there are divergences of opinion, we are the swing state. World leaders are comfortable with us; they trust us. So in March 2024, India’s Prime Minister spoke to the Russian President and also to the latter’s implacable foe—the President of Ukraine.
Bharat has not taken sides or abused one or the other side. So, everyone expects us to find a solution. No one trusts China’s mediation, and the peace plan it came out with two years ago is dead.
The Ukrainian Foreign Minister, who had commented acerbically that India was buying Russian oil mixed with Ukrainian blood, came to India in end-March 2024, but unable to overcome his sense of racial superiority (like the Nazis, western Ukrainians claim Aryan decent), tried to give us ‘gyan’, that India’s relations with Russia are based on the Soviet legacy, which was close to extinction, so India should dump Russia and turn instead to Ukraine.
The new India scoffed at him. When I first entered South Block in July 1973, I could sense the silos within the same ministry. A few decades later, we moved to an all-of-government approach. In the last ten years, I have seen an all-people approach.
Foreign policy is no longer under a bushel; the average citizen is interested and tries to understand it, especially after the ‘janbhagidari’ of the G-20 Summit in New Delhi in September 2023, with sessions in over 250 cities. Its successful organisation immeasurably boosted our self-confidence, and foreign affairs became every Bharatiya’s concern.
A country’s foreign policy reflects its domestic capacity. I was a student at the National Defence College in 1991, when the Soviet Union imploded. There were many predictions in the mainstream media (since social media did not exist) by self-styled experts that with the demise of India’s best friend, New Delhi would face insurmountable challenges. Such analysts have always been in denial of India’s resilience and mastery over ‘jugaad’. Liberalisation of the economy came, and India grew from strength to strength. Our nuclear tests of the late 1990s shook the world, but since we were now a declared nuclear power (a foreign policy masterstroke), no one wanted to seriously offend us (except a few minor western nations stuck in a time warp) who hectored us and imposed meaningless sanctions. The smaller ones screamed the loudest, even though the budget of a mid-sized Indian municipality was more than their GDP!
Pakistan attacked us in 1999, scampered away with our boot imprint on its rear, and the world took note of our military strength. In 2000, our young IT experts successfully obliterated the Y2K bug in computer systems across several countries. Information technology multinationals rushed to Bengaluru, and those who lost their jobs in their home countries talked of being “Bangalored.”
Tired of the shenanigans of the Masters of the Universe, in 2003 we decided to decline all foreign aid—our self-confidence skyrocketed. In particular, the atavistic British, unable to forget that aeons earlier they had been a great power, felt cheated of their destiny to be a perennial aid donor. There were furious debates in the ensuing years in the House of Commons and the House of Lords, but did we collapse?
Quite to the contrary, India’s all-round prowess was quickly on display. The Quadrilateral Security Dialogue, or QUAD, arose from the 2004 tsunami, in which we were the first responders, along with three other nations involved in rescue operations: the USA, Japan, and Australia. In clear view was Bharat’s ability to put together an impressive fleet within days and assist its maritime neighbours like Sri Lanka, the Maldives, Bangladesh, and Indonesia—32 ships and 5,500 naval personnel, even as it carried out magnificent relief efforts in Tamil Nadu and the Andaman and Nicobar Islands.
“It will be a key pillar of stability in the Indo-Pacific region,”[1] Prime Minister Narendra Modi said at the first-ever Quad Summit. Make no mistake about it: Quad will grow faster now and willy-nilly will become the core of the Free and Open Indo-Pacific (FOIP) vision, with a “tough security-oriented core and a softer and inclusive exoskeleton that prioritises the developmental agenda.”[2] As our reputation as an effective international player soared, so did our economy. Robert Merton’s Law of Unintended Consequences had kicked in. By 2007, we were a one trillion dollar economy!
Our technological prowess excited admiration and envy in equal measure. In 2017, we deployed 104 satellites in sun-synchronous orbits in a single mission, an unbroken world record. If the economy and popular will are strong, a country’s international relations reflect that. As a Special Advisor in some African nations, I see that their self-confidence and self-esteem are abysmal, so their renaissance falters. Unable to deny Bharat’s amazing progress, some western NGOs and so-called think-tanks (they tank because they cannot think) derive ghoulish delight from running Bharat down on all manner of “indices”—freedom, democracy, happiness, media, output, etc. At least it gives us a good reason to laugh.
We have reached our present level of development as the fourth-largest economy in the world and as a vibrant democracy with all its warts and weaknesses. We do not impose our views on our partners but ask them to define their priorities that we try to respond to. Nor do we keep supervising projects that we fund in other countries; we give them space and respect their competence. We do not pontificate on good governance. Our soft loans are among the most generous in the world, with a very large grant element. Our human resource development partnership is most sought-after, with thousands of scholarships every year.
Bharat’s medical facilities are the best in the world, and when I travelled back to Bharat recently from New York, the American cabin crew told me how they come to Bharat regularly for dental treatment that is much better and far cheaper than anywhere else. When the present regime took over 10 years ago, many of the same naysayers predicted that foreign affairs would be Narendra Modi’s weakest link, given his lack of expertise. How wrong they were! He hired the best in the trade, turned the system of non-alignment on its head, dumped the cliches in our foreign policy establishment, and made new friends across the globe. Since we could not give away Kashmir, he decided to wean away Pakistan’s supporters. And how!
Today, Pakistan is totally isolated, even in the Islamic world. Its economy is in a coma, kept alive in the Critical Care Unit of the International Monetary Fund with some oxygen from China and a couple of others. Arab nations have vied with each other to give Bharat’s Prime Minister their highest national honours. Soon after the visit of its Sultan to Delhi, Oman allotted a specific zone to Bharat in the strategically located Port of Duqm, which overlooks the Gulf of Oman, the Arabian Sea, and the Indian Ocean, a development that will enhance Bharat’s role in the western and southern Indian Ocean region.
Bharat’s assertion of its strategic autonomy has been anathema to some external powers, but that has not deterred New Delhi. It was clearly visible in the curt response given by the MEA to comments made by Germany, the United States, and the United Nations on the arrest of Delhi’s Chief Minister. New Delhi promptly and publicly ticked them off for commenting on Bharat’s transparent and democratic judicial system. The Indian media too went to town, pointing out that we had not commented on the apparent witch hunt against a former US President, and wondering why this Chief Minister’s arrest had so rankled the West. In another earlier incident, wherein the Prime Minister of Canada, Mr. Justin Trudeau, accused Bharat of complicity in killing one of its citizens on June 18, 2023, New Delhi simply called the accusation “absurd”[3] and asked Canada to remove 41 of its 62 diplomats from its overstaffed mission in the country.[4] Here too, the people of Bharat, masters of social media, were more aggressive in their response, which once again is an expression of a New Rising Bharat. It was the same Mr. Trudeau who made unwarranted comments about Canada being “there to defend the rights of peaceful protest” when farmers in India were protesting in 2020. This too was responded to firmly by the Government of India. Now, in 2024, he has not uttered a word in support of protesting Indian farmers. Things certainly have changed in the last decade!
In January 2024, three ministers from the Maldives made derogatory comments on Bharat’s prime minister, after he tweeted a photo of himself at a beach in Lakshadweep and asked Bharatiyas to go and see it. The swift and angry response from Bharatiyas resulted in the cancellation of holiday trips to the Maldives by many Indians, prompting local tour operators to beg for forgiveness. Faced with unsustainable debt, the new prophet of Islam, the President of the Maldives, now begs Bharat to reschedule the payments due to it.
Bharat’s articulation on the world stage, including the “one-liners” by its foreign policy leadership and its firm actions in the face of major international challenges, not only brought laurels to it but forced the world to sit up and take note. In 1947, our bodies became free. In 1971, our strength was liberated. In 2022, Netaji Subhas Chandra Bose took his rightful place in our pantheon of heroes, and our minds were unshackled. In 2023, Chandrayan liberated our self-confidence, and in January 2024, when “Ram Lalla’ came home, our souls were liberated.
Our pride soared when we got our own state-of-the-art Parliament building and rediscovered the ‘Sengol’, derived from the Tamil word “Semmai” for “righteousness” and associated with the Chola Empire. This Empire was one of the longest-ruling and most influential dynasties in South Bharat, and was known for its military prowess, maritime trade, administrative efficiency, cultural patronage, and temple architecture.
Swami Vivekananda said: “I see that each nation, like each individual, has one theme in this life, which is its centre, the principal note around which every other note comes to form harmony.”[5] As we look into our past with pride, there is, on every side, a fresh manifestation of life. It is out of this past that the future is being moulded. Proactive diplomacy, together with strong ground positions, is Bharat’s new mantra, which its bullying northern neighbour now understands at a cost.
Numbness and pussyfooting dominated Bharat’s foreign policy for decades after independence. We always punched much below our weight. There were some sporadic exceptions in the neighbourhood, like Prime Minister Indira Gandhi’s actions during the 1971 Bangladesh War or our intervention in the Maldives in 1988 to prevent a coup. But Bharat was seen as a pushover by all and sundry in the world till we resolutely stood up to international pressures with our 1998 nuclear tests.
Gone are the days when our leaders delivered marathon speeches at the UN. “I can say in six minutes what V. K. Krishna Menon took hours to do at the UN. We should stop giving ‘gyan’ to the world and worry about our national interests,”[6] Bharat’s outstanding External Affairs Minister told Parliament in August 2022.
In May 2023, in Port Moresby, Papua New Guinea Prime Minister James Marape bent down to touch the feet of PM Narendra Modi, who was there to host the third summit of the Forum for Bharat-Pacific Islands Cooperation. The respected public affairs company, Morning Consult, has consistently ranked Narendra Modi first among 22 world leaders with a huge approval rating, well ahead of the second-placed leader. According to a report by American investment banker Morgan Stanley in May 2023, “in just a decade, Bharat has gained positions in the world order with significant positive consequences for the macro and market outlook.”[7] The report lists 10 big changes (including supply-side policy reforms, formalisation of the economy, digitalising social transfers, a focus on FDI, and government support for corporate profits) that have propelled MNC sentiment to a multi-year high. The New York Times, which for the most part writes rabidly anti-Bharat articles, has acknowledged the explosive growth of Bharat’s space tech startups (over 140 and fast growing) and says Bharat is set to “transform the planet’s connection to the final frontier.”
US-based semiconductor company Micron Technology said it was surprised by how quickly Bharat implemented its side of the deal, and it had to move very fast for Bharat’s first chip facility in Gujarat, which will create 5,000 direct and 15,000 indirect jobs in the coming years. Apple says it is easier to do business in Bharat than in China. Taiwanese giant Foxconn signed a deal with Tamil Nadu to invest almost USD 200 million in a new electronic component manufacturing facility that will create 6,000 jobs.
The CEO of McKinsey & Co. says it is not just Bharat’s decade, but Bharat’s century. He is spot-on. In foreign policy, we have the duck syndrome. Everything seems placid on the surface, but below, the feet are paddling furiously. That is how we brought our sentenced-to-death naval heroes home from Qatar.
Since the present Prime Minister came to power, I have seen success after success in our foreign relations. Our diplomacy in modern Bharat is cost-effective and result-oriented. We discuss, negotiate, and respond with facts and figures. Narendra Modi’s incessant visits and “hugplomacy” are how legends are born. In 2021-2022, we gave free vaccines to dozens of poor countries, while the West hoarded its stocks to sell them for a profit. The global appreciation for India’s gesture was amazing.
Our relief for Nepal, devastated by a huge earthquake in 2015, arrived within 8 hours (the rich nations were expressing condolences), and the Nepalese Prime Minister said his country was blessed to have a neighbour like India. A year earlier, we had quenched the thirst of Maldivians with desalination plants on two Bharati ships. We pulled Sri Lanka out of the Chinese pit into which it had fallen. We are ensuring safety in the Red Sea and rescuing sailors from around the world. When her children were insecure in Lebanon, Syria, Ukraine, Sudan, Libya, or Israel, Bharat Ma reached out to bring them home. One Arab Minister told me that with America having run away from the region, Russia being occupied elsewhere, Europe in distress, and China totally unreliable, their best hope for a “security provider” (and I quote verbatim) is a “superpower called Bharat!”
When earthquakes hit Syria and Turkiye, we were the first responders. When food-stressed nations needed cereals, we were the first to help. Bharat joined the Missile Technology Control Regime in 2016, as blatant proliferator China is not a member and could not block Bharat’s entry. Unable to stomach a rising Bharat, China tries its best to hurt us, even as its own economy tanks, foreign investment declines dramatically, and its international reputation is in tatters. It has consistently blocked our membership in the Nuclear Suppliers’ Group, a 48-member body that requires consensus to admit new members. Bharat formally applied for membership in 2016.
China, stung by our solid rejection of its dying Belt and Road Initiative that it wanted Bharat to join, is now exhibiting a hellish fury, like a woman scorned. The 2020 Galwan conflict and the 2022 Tawang episode reflect that rage. China will never accept Bharat’s rise since it fancies itself as the next master of the universe. In a few decades, will its 9-dash line become a 99-dash line to include the entire galaxy and Milky Way?
I am not being facetious. Take the case of ASEAN. China once considered ASEAN its sidekick, and ASEAN was too timid to assert itself. In July 2010, at the ASEAN Regional Forum (ARF) meeting in Hanoi, the Chinese Foreign Minister, fuming at the temerity of 10 countries that had raised the contentious South China Sea dispute, stared at his Singaporean counterpart and thundered, “China is a big country, and other countries are small countries, and that is just a fact.”[8]
Some years ago, an ASEAN leader called the association an aircraft, with China and Bharat as the wings. But as the China wing is destabilising, the Bharat-ASEAN dynamic has added a military dimension. We have been participating in joint drills in the region at least since 2019.
China has claims to the territories and waters of almost all ASEAN members. Just a few days before the G-20 Summit in New Delhi and the ASEAN Summit in Jakarta, China published a new standard map of China showing large parts of Bharat, Vietnam, Malaysia, the Philippines, Brunei, Indonesia, and Taiwan as Chinese territory. Led by Bharat, the affected nations lodged strong protests. To avoid facing the international media, Xi Jinping decided not to attend the summits.
In December 2023, a Bharati warship, on a goodwill visit, docked in Manila after passing through the contested South China Sea (claimed by six nations). In 2016, China contemptuously rejected a UN Tribunal’s judgement that awarded disputed islands to the Philippines. In a joint press conference in March 2024, the Foreign Minister of the Philippines said that the bilateral relationship had reached unprecedented levels, while his Indian counterpart promised to stand by Manila regarding its territorial integrity. China saw red and said third parties should not interfere in bilateral disputes, conveniently forgetting China’s role in Pakistan-occupied Jammu and Kashmir.
The Philippines has bought 100 Brahmos missiles from India in 2022 against a soft loan; delivery has begun. In December 2023, Bharati military officers were in Vietnam for interoperability exercises. Hanoi acquired its first Indian frigate in June 2023 and wants the Brahmos missiles. So does Indonesia, which in 1965 was keen to grab the Nicobar Islands but in 2024 is jointly developing with India the crucial Sabang Port overlooking the Malacca Straits. China’s attempt to build a so-called string of pearls around India is effectively being countered by India’s necklace of diamonds.
Bharat got the 54-member African Union into the G-20; the Western nation that chaired an earlier summit brought in the European Union. This one gesture reverberated across the developing world but hurt egos elsewhere. In January 2023, Prime Minister Narendra Modi chaired a virtual meeting of 125 developing nations and asked for their pressing concerns, which were then incorporated into the September 2023 Delhi Declaration. The brave new Bharat is recognised globally for its strategic autonomy, resolute response, and risk-taking appetite.
Bharat’s articulation on the world stage and its firm actions in the face of major international challenges have brought laurels to it and forced the world to sit up and take note. We are admired for being the leader of the Global South; we prefer to be partners in BRICS, G-20, or SCO.
In 2022, after Russia invaded Ukraine, US President Joe Biden asked us to criticise Russia; when we did not do so, he called our position “shaky,” and his officials issued their standard warning of “consequences” if we did not fall in line. We scoffed, continued with our policies, and lo and behold, America continued to maintain cordial relations with us.
Since independence, total FDI in Bharat has been close to USD 1 trillion, and half has come in the last 10 years from over 160 countries in more than 60 sectors. Narendra Modi has reminded us that power respects only power. I call him Jambavanta, who aroused Shri Hanuman’s latent power in the Ramayana.
So long as it forgot its past, Bharat remained in a state of stupor, and as soon as Bharatis have begun to look into their past, there is on every side a fresh manifestation of life. The more, therefore, that Bharat understands its past, the more glorious will be its future.
“Proactive diplomacy together with strong ground positions” is Bharat’s new mantra.
Narendra Modi has given us self-confidence, self-esteem, and self-reliance.
170 years ago, Victor Hugo said that no power on earth could stop an idea whose time has come. We have come of age. Bharat’s time has come.
Thank you, Prime Minister. Every Bharati stands six inches taller.
Author Brief Bio: Ambassador Deepak Vohra is a former diplomat and a former Ambassador of India to Poland. He has served in France, Tunisia, United States, Chad, Cameroon, Papua New Guinea, Spain, Armenia, Sudan and Poland. He is currently a special advisor in Africa.
References:
[1] https://www.livemint.com/news/india/quad-has-come-of-age-will-be-key-pillar-of-stability-in-indo-pacific-pm-modi-11615556767376.html
[2] https://sundayguardianlive.com/news/quad-making-china-quadriplegic
[3] https://www.nytimes.com/2023/09/18/world/canada/canada-india-sikh-killing.html#:~:text=The Canadian leader said agents,called the accusation “absurd.
[4] https://www.nbcnews.com/news/world/canada-removes-41-diplomats-india-rcna121343
[5] https://www.swamivivekananda.guru/2021/05/10/swami-vivekananda-the-india-personified/
[6] https://theprint.in/world/we-should-play-our-role-be-less-concerned-about-giving-gyan-to-world-over-foreign-policy-jaishankar-in-lok-sabha/905896/
[7] https://www.hindustantimes.com/india-news/this-india-is-different-from-the-one-in-2013-morgan-stanleys-transformation-report-101685527464704.html
[8] https://jamestown.org/wp-content/uploads/2010/12/cb_010_3d52c6.pdf, page 4.
Securing the Nation Against Internal and External Threats

It’s been 10 years since Prime Minister Narendra Modi assumed the stewardship of the world’s largest democracy. He accepted the daunting challenge of making a population of more than 140 crore feel safe and secure and maintaining peace inside the country and at its borders.
With a 15,106.7 km land border and 7,516.6 km coastline, India faces internal and external threats. The country has been grappling with domestic and transnational terrorism, insurgencies in the Northeast, left wing extremism (LWE), and the permanent threat from Pakistan and China. As threats persist, more concerted and decisive action is needed so that India can focus better on health, education, and development.
Internal threats
Terrorism in Jammu and Kashmir (J&K) has been the biggest internal security threat to India since the late 1980s. According to the South Asia Terrorism Portal, more than 15,000 civilians and around 7,000 security personnel have been killed by terrorists in J&K from 1988 to March 2024[1]. The National Democratic Alliance (NDA) government’s track record in tackling terrorism in J&K is better than that of the United Progressive Alliance (UPA). The number of terror attacks decreased by 68% from 4,117 in 2004-2014 to 1,313 from 2014 to March 2024.
Unlike the Manmohan Singh government’s soft approach to the festering problem, the Modi government’s tough stance against Pakistan, separatist organisations, and on overground workers sheltering terrorists, as well as the intensified cordon-and-search operations, and sharing of intelligence inputs on a real-time basis among security forces, are responsible for the change. In the last 10 years, more than 50 terrorists and 44 terrorist organisations have been banned under the Unlawful (Activities) Prevention Act[2].
To root out terrorism in J&K completely, a three-pronged approach is needed. First, terrorist sympathisers, separatists, and overground workers must be ruthlessly targeted. Overground workers provide logistics, cash, and shelter to terrorists. In October 2021, the J&K Police arrested more than 900 overground workers of Lashkar-e-Taiba (LeT), Jaish-e-Mohammed, Al-Badr, and an offshoot of the LeT, The Resistance Front.
More assets of pro-Pakistan separatist organisations and their leaders must be attached. In December 2022, several properties of the banned Jamat-e-Islami worth around Rs 100 crore, including a house registered in the name of late Hurriyat leader Syed Ali Shah Geelani, were attached. People like Geelani, who brazenly spearheaded protests against India and supported Pakistan, should have been jailed long ago. Unless such leaders are jailed, they will continue to foment anti-India feelings and radicalise the Kashmiri youth. In his book Kashmir: The Vajpayee Years, ex-RAW chief AS Dulat described Geelani as the father of jihad in J&K.
New Delhi can’t control Islamabad’s financing of terrorism, but it should persuade global powers to put Pakistan back on the grey list of the America-controlled Financial Action Task Force (FATF). In 2021, Islamabad declared 26/11 co-perpetrator and LeT operative Sajid Mir ‘dead’. Shockingly, he was convicted by a Lahore court before the FATF plenary session in June 2022, and Pakistan was removed from the list after a few months in October.
Second, a massive intelligence network with information sharing between the Army, Central Armed Police Forces (CAPF), and police personnel operating in J&K is needed. The IB and RAW can augment their capabilities by taking tips from Israel’s Shin Bet and Mossad, which excel in spying and targeting terrorists.
Intelligence gathering and tracking suspects also prevent attacks and the formation of terror outfits. A combination of open-source intelligence (OSINT), social media intelligence, financial intelligence, geospatial intelligence, human intelligence (HUMINT), signals intelligence (SIGINT), communications intelligence, electronic intelligence, imagery intelligence (IMINT), technical intelligence, and cyber or digital network intelligence will be effective in foiling terror plots[3].
India also needs to fully exploit the use of drones in its counter-terrorism strategy because they can be used for monitoring, surveillance, and targeting terrorist hideouts, terrorists, and suspects without endangering security forces. For example, an RQ-170 Sentinel continuously watched Osama bin Laden’s Abbottabad compound before he was killed in 2011. Drones can track the movement of terrorists for a long time and provide topography details, especially in areas where HUMINT isn’t possible.
Third, developmental projects, employment schemes for the youth, more investment in the Union Territory (UT), counselling of radicalised and misguided youth, and rehabilitation of surrendered terrorists will provide a healing touch. Anxiety, depression, substance abuse, and joblessness among youth are the results of decades-long terrorism. Providing jobs will make the youth confident, ensure their future, and dissuade them from getting radicalised. According to government data, 7.4 lakh livelihood opportunities have been created since 2021-22, and 31,830 government vacancies have been filled since August 2019[4].
The government has already taken several measures to provide a livelihood, like Mission Youth, which aims to engage and empower youngsters in the 15-25 age group[5]. Gradually, the youth have realised the futility of joining terrorist outfits. As per police data, 199 youths joined militancy in 2018 (the highest in a decade), 126 in 2019, 167 in 2020, 125 in 2021, and 110 in 2022, but only 10 joined terror groups in 2023.
J&K needs both government and private investment to bolster its economy. The government should convince investors to invest more by providing better safety and security. Lieutenant Governor Manoj Sinha has claimed investments worth Rs 13,000—Rs 14,000 crore till 2021. By September 2023, investments worth Rs 26,000 crore were “on the ground,” and investments by 2025 were projected at Rs 75,000—Rs 80,000 crore[6]. In February 2024, Prime Minister Modi launched development projects worth Rs 32,000 crore in the education, railway, aviation, and road sectors.
While dealing with Left Wing Extremism (LWE), the UPA government under Dr. Manmohan Singh termed Naxals the “single biggest internal security challenge” to India. In the last 10 years, the NDA government has adopted a better strategy, focused on developing Naxal-hit states and increasing coordination between their police and the Centre. Home Ministry data shows that violence in 2014-23 decreased by 50%, fatalities by 66%, and deaths of security forces by 71%, compared to the UPA’s rule[7].
Chhattisgarh remains a challenge. From 2018 to 2022, 1,132 Maoist attacks were reported, killing 168 security personnel and 335 civilians, with the state accounting for more than 30% of the attacks and 70%-90% of deaths. In 2023, 25 security personnel and 32 civilians were killed by Maoists in the state. With the BJP back in power in Chhattisgarh, better police coordination and intelligence sharing between the Centre and state governments can incapacitate Naxals.
Scheduled Tribes (STs), comprising 30% of Chhattisgarh’s population, are an easy target of Naxals, who fuel their frustration about the lack of jobs, land reforms, proper rehabilitation and resettlement, empowerment, economic opportunities, developmental efforts, and corporate abuse and manipulate them into joining their ranks. While land acquisition for industrialisation is necessary, not making tribals stakeholders will increase the sense of deprivation and frustration. Land acquisition should be transparent and fair, followed by immediate rehabilitation, resettlement, and employment. Jobs will discourage youths from resorting to violence against the government. Besides, tribals living on forestland for years and earning a livelihood should be provided land rights, not uprooted for development.
Illiterate teenagers and youth are easily brainwashed by Maoist ideology and armed struggle. Establishing more Eklavya Model Residential Schools, which provide free education to ST children from class 6 to 12, will help counter Maoist propaganda, indoctrination, and mobilisation[8]. Besides, improving road and telecom connectivity will help not only tribals but also security forces in combating Naxals.
While a ruthless approach is necessary to combat LWE, the police should be sensitised on gender issues, particularly in dealing with women. Harsh interrogation methods against suspects will alienate them and drive them towards Naxals. Better intra-state and state-centre coordination and intelligence sharing, modernising the police, and setting up more camps in deep jungle areas are the only ways to break the back of the Naxals. Here, too, a combination of SIGINT, HUMINT and IMINT can play a critical role in tracking and hunting them down.
The Northeast, except for Manipur, has been relatively calm in the last few years. Violence in the Northeast has decreased by 73% from 11,121 incidents in 2004-2014 to 3,114 incidents in 2014-2023[9]. The number of security forces and civilians killed has decreased by 71% and 86%, respectively. The Armed Forces Special Powers Act (AFSPA) has been removed from several districts of all the states in the region. The Act has been removed from Meghalaya and Tripura, 60% of Assam, 19 police stations in Manipur, and 15 police stations in Nagaland. In Arunachal Pradesh, the Act is in force in only three districts.
After bringing several insurgent groups to the negotiating table under the ‘Act East’, ‘Act Fast’, and ‘Act First’ mantras, the government signed agreements with Manipur’s United People’s Front and Kuki National Organisation, Tripura’s National Liberation Front, Assam’s Karbi Anglong groups, and others. However, it has been more than eight years since the Naga Peace Accord was announced in August 2015. Still, no deal has been signed despite several dialogues with the National Socialist Council of Nagaland (Isak-Muivah) and the Working Committee of the Naga National Political Groups since 1997 and 2017, respectively. Before the situation gets out of control, renewed efforts to bring the various Naga factions and political groups to the table, iron out the kinks, and bring about permanent peace are necessary. While accepting the NSCN (I-M)’s demand for a separate flag and constitution for Nagas is unacceptable, dialogue is the only option to sign the accord.
Manipur’s volatility is the biggest hurdle to permanent peace in the Northeast. More than 200 people have been killed, 500 injured, and 60,000 displaced since the Meitei-Kuki clashes started in May 2023. Unless the Centre intervenes forcefully and brings the warring communities to negotiations, the situation could become more volatile with the Myanmar refugee problem. Blaming Meiteis or Kukis is pointless unless their problems are addressed and grievances redressed. Only a proactive role by the Centre, the chief minister, and representatives from both communities can end the violence.
Cyberattacks, like terrorism, can be launched from both inside and outside India. The highest number of state-sponsored cyberattacks in 2023 was against India at 13.7%, according to Singapore-based cybersecurity firm Cyfirma’s 2023 India Threat Landscape Report. Between 2021 and September 2023, cyberattacks increased by 278%, with IT services and BPO firms being the main targets. Cyberattacks against government agencies went up by 460%[10]. According to network, security, and privacy services portal Comparitech’s 2024 cyber safety report, India ranks sixth among 75 countries, with one being the least cyber-secure country[11].
Information was enunciated as the fifth dimension of warfare after land, sea, air, and space in 1995. Since the People’s Liberation Army is not battle-hardened like the Indian Army, having fought the last war in 1979, China will use asymmetrical tactics in a military confrontation with India. Cyberattacks form the most critical component of China’s asymmetrical warfare. Even Army Chief General Manoj Pande said recently that “disruptive technologies are transforming the character of modern wars and blunting the conventional combat ratios, which were the measure of the military’s strength and superiority in the past.”[12]
While India is cognisant of the threats it faces in the cyber, electromagnetic spectrum, and space warfare domains, much work needs to be done in these fields to negate the threats to its national security. Besides, the danger of non-state actors hacking government organisations and obtaining the personal details of citizens is another challenge. The Reserve Bank of India’s latest Financial Stability Report reveals that 13,20,106 cyberattacks were launched against the financial sector between January and October 2023[13].
External threats
Pakistan and China will continue to be permanent external threats, despite India reaching out to its hostile neighbours several times.
In Pakistan’s case, the line between internal and external threats is blurred as Islamabad continues its proxy war by exporting terrorists to destabilise India, especially J&K. Therefore, eliminating terrorism in J&K is more important to deal a body blow to Pakistan’s sinister designs, as it’s not in a position to fight another war with India due to its economic mess and the close India-United States ties. With foreign exchange reserves of merely USD 8 billion, an external debt of USD 125 billion, a growth forecast of 1.9%, and an expected inflation rate of 25% in FY2024, Pakistan can’t afford another war.[14]
India’s biggest threat is China, with its increasing territorial ambitions ranging from Ladakh to Arunachal Pradesh. Though the chances of a fifth India-Pakistan war are remote in the short term, India needs to augment its military capabilities rapidly to counter the twin threats on its eastern and western borders.
The Modi government has increased its defence budget by more than 2.5 times, from Rs 2,29,000 crore in 2014-15 to Rs 6,21,540 crore in 2024-25 (the interim budget), with the highest amount allocated to the Ministry of Defence.[15] However, India should procure more arms and ammunition, other defence equipment, multirole fighter aircraft (MRFAs), a 5th-generation stealth fighter jet, armed drones, and additional nuclear ballistic missile submarines (SSBNs) and nuclear attack submarines (SSNs) from top foreign companies and under the Make in India initiative as joint ventures at a faster pace.
The Indian Air Force (IAF) has only 32 squadrons, against the sanctioned 42. Adding the order for four Tejas Mk 1A and six Tejas Mk2 squadrons and the plan to acquire six squadrons of the 5th-generation Advanced Medium Combat Aircraft (AMCA) and six 4.5-generation multi-role combat MRFA squadrons, a total of 22 squadrons are due for induction[16]. However, 15 squadrons would retire this decade, meaning only a net addition of seven squadrons (39), still short of 42, which won’t suffice in a two-front war. Though the Cabinet Committee on Security cleared AMCA’s design and development in March, the aircraft won’t be inducted before 2030[17]. The tentative deadline is too far considering that AMCA was scheduled for a test flight in 2024-25 and manufacturing by 2028-29. India can’t afford such delays, especially when China’s second 5th-generation aircraft, the Shenyang J-31, is under development and Pakistan plans to buy it[18].
Similarly, the procurement of 114 MRFAs has been delayed despite the IAF floating the request for interest in 2018. The acquisition of MRFAs shouldn’t be delayed when Dassault has an edge with the IAF operating two Rafale squadrons and the Navy opting for 26 Rafale-Ms (Marine) for INS Vikrant. The Rafale-Ms must be acquired quickly to replace the Navy’s aged MiG-29Ks, which shouldn’t operate until 2035 as planned. Besides, India is servicing and maintaining Rafales, which will do away with the evaluation and trials of other contenders.
The IAF also needs long-range strategic bombers, particularly with China having 120 H-6 bomber variants (conventional, nuclear, and reconnaissance) and developing the Xian H-20 subsonic, stealth, strategic bomber, expected to enter service in 2025. Strategic bombers play an important role in wars by striking deep inside enemy territory and destroying military installations and equipment.
India must also bolster the Navy’s deterrence and striking capability to ensure maritime security and seaborne trade, respond to emergencies, and counter China in the Indian Ocean Region. Under the cover of its Belt-Road-Initiative, China, which has the world’s largest navy, plans to build three more military bases after Djibouti, Africa, in the next two to five years—Hambantota, Sri Lanka; Bata, Equatorial Guinea; and Gwadar, Pakistan[19]. Therefore, two more aircraft carriers and additional SSNs, warships, and drones are urgently needed.
Four carrier battle groups will make sure that India’s western, eastern, and Andaman naval bases are guarded if the fourth aircraft carrier is under routine maintenance. China launched its third and most advanced carrier, Fujian, in June 2022 and plans to have two nuclear-powered carriers. The construction of a second indigenous carrier has already been delayed, with the Defence Acquisition Council yet to clear it. Therefore, the carrier won’t enter service before 2035. Besides, the initial plan of having a nuclear-powered 65,000-tonne carrier was jinxed due to budgetary concerns. Subsequently, the Navy had to settle for a 40,000-tonne carrier on the lines of the 45,000-tonne indigenous INS Vikrant. India’s other carrier, INS Vikramaditya, has a displacement of 44,570 tonnes.
In a war with China, Indian carriers will be pitted against the 80,000-tonne Fujian, 60,000-tonne and 66,000-tonne Liaoning Shandong. India needs heavy nuclear-powered carriers, which pack a bigger punch as they have more fighter/bomber jets, sensors, and weapons, unlimited range and endurance, don’t require frequent fuel replenishment, generate more electricity, and are floating airbases.
It’s an anomaly that India, given its no-first-use policy, doesn’t even have one SSN while China has six. Under Project-75 (India), conceived in 1997, 6 conventional attack submarines and 18 conventional submarines were supposed to be constructed by 2030. However, the project was cleared after 10 years in 2007 with no progress. The NDA government finally gave it a fresh ‘Acceptance of Necessity’ in February 2019, but it took another two years before the formal tender was issued.
India needs to opt for SSNs, which can remain completely submerged for years without detection. After the lease of INS Chakra and INS Chakra II ended, India is looking to acquire Chakra III, which Russia will develop under a deal signed in March 2019. The stated delivery time is 2025.
A country’s nuclear triad is incomplete without an SSBN, which can guarantee survivability in a nuclear conflict. India has only one SSBN, INS Arihant (S2), armed with K-15 short-range (750 km) SLBMs, which can hit only south Pakistan and no important targets in China. The 3,500-km intermediate-range SLBM K-4 has been tested but has not entered serial production. The second Arihant series SSBN, INS Arighat (S3), was launched in 2014 but hasn’t been commissioned. Though the third in the series, codenamed S4, is highly classified, UK-based Janes Defence Weekly reported that it was quietly launched at Visakhapatnam’s Ship Building Centre in November[20].
Similar procrastination and lack of urgency plagued the hunt for a robust infantry rifle for the last 13 years after the indigenously developed INSAS 5.56x45mm was declared operationally unfit over its sights and firing mechanism in 2010. The Indo-Russian Rifles Private Limited, formed in 2019, to manufacture 671,000 AK-203 7.62x39mm rifles locally, has been delayed due to the Ukraine War. Consequently, the government approved the purchase of an additional 70,000 SIG Sauer SIG716 7.62×51mm rifles last December to meet the shortfall[21].
As the Indian Army is the largest user of small arms globally, issuing a world-class rifle with a standard calibre quickly should be prioritised. Internal tests, acceptance, and user trials took years before the INSAS was inducted. While the Defence Research and Development Organisation (DRDO) deserves a pat for producing the 7.62x51mm Ugram rifle in a record 100 days, tests and trials should be expedited to induct them quickly. Moreover, upgrading an operationally unfit INSAS to reduce costs and meet the shortfall is pointless. Besides, India must use a standard calibre in the 7.62 series. Producing 7.62x39mm (AK-203 and AK-47) and 7.62x51mm (SIG Sauer and Ugram) rounds in a war will be difficult.
India also urgently needs a light tank to counter the 33-tonne Chinese Type 15 tank (ZTQ-15), deployed on the Tibetan plateau during the 2020 eastern Ladakh standoff. The ZTQ-15 is highly agile, even on plateaus, and entered service way back in 2018. China conducted integrated and comprehensive air force and army drills involving the tank on the Qinghia-Tibet in 2020, considering the threat from Indian tanks and armoured vehicles.
The T-72, T-90, and indigenous Arjun tanks are too heavy to operate in mountainous terrain. India realised the urgency of a light tank during the Ladakh crisis. Yet the project was launched two years later, with development trials scheduled for April and May of this year[22]. Only the Russian Sprut-SDM1 meets India’s need for an amphibious 25-tonne tank, but a deal hasn’t been signed yet.
Make in India
The Atmanirbhar (self-reliance) Bharat Abhiyan, which aims to provide impetus to Make in India, has boosted self-reliance in defence. According to government data, the expenditure on defence procurement from foreign sources decreased from 46% of overall expenditure in 2018-19 to 36.7% in December 2022. On the other hand, defence exports jumped by 21 times from Rs 4,312 crore in the UPA era to Rs 88,319 crore in the last 10 years[23]. To reduce further dependency on imports and turn Make in India into a global success story, immediate reforms are needed.
First, India continued to be the world’s largest arms importer, accounting for 9.8% of total global sales, with 36% of imports from Russia in 2019-23[24]. Russian weapons comprise 60% of India’s military hardware, ranging from tanks and missiles to fighter jets and their spares. However, unforeseen events like the Ukraine War have affected the delivery of Russian weapons, like the joint production of the AK-203 rifle. In March 2023, the IAF said that Russia wouldn’t be able to deliver a “major” platform without naming it as India awaits two more S-400 Triumf air defence systems[25].
Reducing imports by making world-class defence equipment fast is the only way to sustain supply lines despite cataclysmic events. Therefore, more funds are needed for self-reliance. However, the DRDO’s allocation in the interim budget was increased to only Rs 23,855 crore from Rs 23,263 crore last year.
Second, long deadlines and delivery delays, which escalate costs, must be avoided. Delays can be dangerous in the event of an impending war where ramping up production is the only way to sustain supplies of arms and ammunition to the military. For instance, the delivery of 118 Arjun Mk 1As has been delayed after Germany couldn’t supply the MB 838 Ka-501 V10 engines. Later, DRDO decided to develop the indigenous Datran 1500 engine, which won’t be delivered for three years[26]. Similarly, the 55-tonne, all-terrain, and AI-enabled Future Ready Combat Vehicle, a replacement for the T-72, will be inducted only by 2030[27].
Third, more private sector companies should be allowed into defence, which will enhance the sector’s capability and competitiveness. India opened the sector to 100% domestic private sector participation in May 2001, but the share of private companies in total defence production of Rs 73,739 crore in 2023-24 was only 21.96%[28].
Exclusive public sector participation in manufacturing fighter jets, helicopters, submarines, and tanks is missing. On the other hand, American weapons giants Lockheed Martin, Raytheon Technologies, Northrop Grumman, Boeing, and General Dynamics were the top five arms sellers in 2022, according to the Stockholm International Peace Research Institute[29].
Involving the private sector in strategic partnerships with DRDO will further enhance technology, innovation, capital, and efficiency. Once DRDO finalises the design, the private partner can design, develop, and manufacture the product, substantially reducing the organisation’s burden and preventing cost escalation and missed deadlines.
Author Brief Bio: Aninda Dey is a freelance journalist with more than two decades of experience and comments primarily on foreign affairs, defence, and terrorism.
References:
[1] httpss://www.satp.org/datasheet-terrorist-attack/fatalities/india-jammukashmir
[2] https://indianexpress.com/article/india/44-terror-groups-banned-4-this-year-mha-8499722/
[3] https://www.osintteam.com/what-is-osint/
[4] https://timesofindia.indiatimes.com/india/over-7-4-lakh-self-employment-opportunities-created-in-jammu-and-kashmir-since-2021-22-union-minister-nityanand-rai/articleshow/105792132.cms
[5] https://missionyouth.jk.gov.in/Schemes
[6] https://theprint.in/opinion/politically-correct/4-years-on-kashmir-is-changing-all-because-of-modi-picked-manoj-sinhas-healing-touch/1766788/
[7] https://timesofindia.indiatimes.com/india/red-violence-down-52-under-modi-government-says-amit-shah/articleshow/107953003.cms
[8] https://pib.gov.in/PressReleaseIframePage.aspx?PRID=1982658
[9] https://www.hindustantimes.com/india-news/10-years-under-modi-govt-have-been-golden-era-for-northeast-says-amit-shah-101705673436529.html
[10] https://thewire.in/tech/state-sponsored-cyber-attacks-against-india-went-up-by-278-between-2021-and-september-2023-report
[11] https://www.comparitech.com/blog/vpn-privacy/cybersecurity-by-country/
[12] https://www.ndtv.com/india-news/defence-summit-indian-army-chief-on-disruptive-tech-vs-conventional-warfare-5199146#pfrom=home-ndtv_topscroll
[13]https://rbidocs.rbi.org.in/rdocs/PublicationReport/Pdfs/0FSRDECB815B9437D6D428F81D45C22BBF6C62A.PDF
[14] https://www.adb.org/sites/default/files/publication/908126/south-asia-ado-september-2023.pdf
[15] https://pib.gov.in/PressReleaseIframePage.aspx?PRID=2001375
[16] https://www.business-standard.com/article/current-affairs/at-least-42-fighter-squadrons-essential-says-indian-air-force-chief-122100400937_1.html
[17] https://www.business-standard.com/external-affairs-defence-security/news/amca-india-scrambles-as-china-builds-up-200-strong-stealth-jet-fleet-124030800873_1.html
[18] https://theprint.in/defence/pakistan-to-fly-j-31-chinese-stealth-fighters-what-this-could-mean-for-balance-of-air-power/1909635/
[19] https://www.aiddata.org/publications/harboring-global-ambitions
[20] https://thewire.in/security/india-quietly-launches-its-third-arihant-class-nuclear-powered-submarine-report
[21] https://timesofindia.indiatimes.com/india/defence-ministry-clears-armys-case-for-73000-more-assault-rifles-from-us/articleshow/105941970.cms
[22] https://www.business-standard.com/india-news/with-an-eye-on-ladakh-drdo-begins-testing-an-indigenous-light-tank-124011500820_1.html
[23] https://pib.gov.in/PressReleseDetailm.aspx?PRID=2016818
[24] https://www.sipri.org/media/press-release/2024/european-arms-imports-nearly-double-us-and-french-exports-rise-and-russian-exports-fall-sharply
[25] https://www.reuters.com/world/india/russia-cannot-meet-arms-delivery-commitments-because-war-indian-air-force-says-2023-03-23/
[26] https://economictimes.indiatimes.com/news/defence/india-likely-to-use-indigenous-en gines-in-arjun-tanks-as-german-engines-getting-delayed-by-four-years/articleshow/107667794.cms?from=mdr
[27]https://www.makeinindiadefence.gov.in/admin/writereaddata/upload/project/project_file/FRCV_(2).pdf
[28] https://ddpdashboard.gov.in/DefenceProduction/Defence_Production
[29] https://www.sipri.org/visualizations/2023/sipri-top-100-arms-producing-and-military-services-companies-world-2022
Digital Leadership for a Viksit Bharat 2047: Fostering Innovation, Shaping Tomorrow

In an increasingly interconnected world, digital inclusion has emerged as a cornerstone of development strategies. Digital India’s overarching goal of transforming the nation into a digitally empowered society and knowledge economy has yielded significant outcomes over the past decade, since the Indian government launched the ambitious “Digital India” programme in 2015. One of the most notable achievements has been the reduction of the digital divide between urban and rural areas and connecting the unconnected. Through infrastructure development initiatives like the BharatNet project, which aims to connect every gram panchayat with high-speed internet, connecting over 250,000 gram panchayats (village councils) with high-speed internet. The government, through consistent efforts and successful collaborative partnerships, has hugely bridged the digital divide, enabling millions of rural Indians to access the internet for communication, education, and livelihood opportunities. This large-scale project, when completed, will connect over 630,000 inhabited villages in India, further bridging the digital gap between urban and rural communities.
Furthermore, the past decade has witnessed a revolution in the availability of smartphones and data plans, leading to a remarkable increase in internet penetration in India. With 850 million broadband users as of July 2023, representing a 250% growth since 2015, India has experienced the fastest growth in internet users globally. The average monthly data consumption per user reached 19.5 GB in 2022, with monthly mobile data usage soaring from 4.5 exabytes in 2018 to 14.4 exabytes in 2022. This exponential growth is expected to continue, with projections indicating a quadrupling of data consumption by 2024, driven by the impending implementation of 5G technology and India’s topping global data consumption in the next five years.
Moreover, the past decade has witnessed a concerted push towards leveraging emerging technologies to address complex societal challenges (Niti Aayog, 2018). The National Strategy for Artificial Intelligence, unveiled by Niti Aayog in 2018, outlines a comprehensive roadmap for harnessing the potential of AI across various sectors, including healthcare, agriculture, and education. With a steadfast commitment to technological development and advancement, the government has embarked on a journey that has led to the economic, technological, and entrepreneurial transformation of the nation. From bolstering digital infrastructure to fostering innovation hubs, the government’s policies have propelled India into the forefront of the global innovation landscape.
Furthermore, the government’s emphasis on promoting indigenous manufacturing through initiatives like “Make in India” has bolstered India’s position as a manufacturing powerhouse (Press Information Bureau, 2014). By incentivising domestic production of electronics, automobiles, and other critical sectors, the government has not only spurred economic growth but also catalysed technology transfer and skill development. The success of initiatives such as the Production Linked Incentive (PLI) scheme underscores India’s growing prowess in manufacturing, attracting investments, and creating employment opportunities on a massive scale (Niti Aayog, “Production Linked Incentive Scheme”). A recent media report has pegged India’s electronic manufacturing industry to show growth upwards of over 40% annually until FY 26, with the market expecting to reach Rs 5,980 billion. A combination of factors have led to this, which include geo-political shifts, the government’s progressive and concerted policy efforts to spur electronics manufacturing in India, the presence of a skilled workforce, which includes highly trained engineering talent, the availability of land and water, a stable responsive government with enhanced ease of doing business, and a clear focus on job creation, upping the value chain to make India the hub of a technology creator for technologies.
In addition to fostering technological innovation, the Modi government has prioritised the development of robust regulatory frameworks to navigate the complexities of the digital age. From enacting data protection laws to strengthening cybersecurity infrastructure, the government has demonstrated a proactive approach to safeguarding citizens’ privacy and securing critical digital assets. Not only is India now in the right rooms, it is now at the table and shaping the discourse, actively seeking accountability and greater transparency and equity in both future and emerging technology as well.
Moreover, Digital India, coupled with the JAM trinity, which includes Jan Dhan, Mobile, and Aadhar, has completely revolutionised governance by leveraging technology to improve openness, effectiveness, and public involvement in the delivery of government services. Digital platforms like DigiLocker, e-Hospital, and e-Government Procurement (GeM) have streamlined processes, reduced red tape, and increased access to essential services for citizens, raising the bar for minimum government and maximum governance. The impact of these initiatives is evident in the significant increase in e-transactions related to government services, which exceeded USD 3 billion in the fiscal year 2021 alone. By embracing digital governance, India has made substantial strides towards enhancing transparency, efficiency, and citizen-centric governance.
Additionally, Digital India has placed a strong emphasis on digital literacy and skill development, particularly in rural areas. Programmes like the Pradhan Mantri Gramin Digital Saksharta Abhiyan (PMGDISHA) have empowered millions of people with crucial digital skills, enabling them to participate actively in the digital economy. The National Digital Literacy Mission (NDLM) and Skill India have further strengthened India’s workforce by providing training in cutting-edge technologies and promoting entrepreneurship. By equipping citizens with digital skills, India is not only fostering economic growth but also empowering individuals to contribute meaningfully to the digital revolution.
To confine the ambit of this discourse, our focal lens shall primarily scrutinise digital transformation and its symbiotic relationship with economic ascension. The performance of the current government at the centre over the last ten years can be summarised under five broad themes: economic growth, digital infrastructure, digital India, entrepreneurship and innovation, and emerging technologies.
Economic Growth
India has experienced a period of unprecedented economic growth since 2014, achieving remarkable milestones along the way. The exponential growth has been witnessed across various economic indicators, propelling India to new heights and firmly establishing its position as a global economic powerhouse. India’s economic growth has been labelled “stable and resilient,” with an 8% growth rate a real possibility in the near future (Gupta and Blum, 2018).
One of the most striking achievements during this period has been the jump from the 11th largest to the 5th largest economy in the world (Armstrong, 2022). The significant expansion of India’s Gross Domestic Product (GDP) reflects robust economic performance and sustained momentum. Since 2014, India’s GDP has surged, far surpassing the growth rates of previous years and outstripping initial projections (see table below). This growth trajectory has not only propelled India’s economy forward but has also positioned it as one of the fastest-growing major economies in the world.

Figure 1: Indian GDP by year: 2006 to 2022 (source: World Bank)
India surpassing the United Kingdom to become the fifth-largest economy globally highlighted India’s growing economic prowess and resilience (World Bank, 2024). This underscored India’s emergence as a key player on the world stage, with significant implications for global trade, investment, and geopolitics.
The government’s bold economic reforms and policy initiatives have played a crucial role in driving India’s economic transformation. From the implementation of landmark reforms such as the Goods and Services Tax (GST) to the promotion of ease of doing business, the government’s proactive approach has fostered a conducive environment for investment, entrepreneurship, and innovation. These reforms have not only streamlined the tax system and eliminated barriers to trade but have also enhanced India’s attractiveness as a destination for foreign investment (PTI, 2024).
Moreover, India’s economic growth has been accompanied by significant improvements in key socio-economic indicators, reflecting the government’s focus on inclusive development and poverty alleviation. The average income of people has witnessed a substantial increase, lifting millions out of poverty and enhancing their quality of life. More than 400 million people were lifted out of poverty in the last 15 years (Pandit, 2023). Even in 2023, India was leading salary growth projections in APAC (Majumdar, 2024). Additionally, initiatives such as the Pradhan Mantri Jan Dhan Yojana (PMJDY) have promoted financial inclusion, ensuring that even the most marginalised segments of society have access to banking services and financial resources (PTI, 2023). Under the scheme, 55.5% of bank accounts were opened by women, while 67% of the accounts were opened in rural or semi-urban areas (ibid.).
India’s exponential economic growth firmly points to the nation’s resilience, dynamism, and potential, especially in a post COVID world. From surpassing previous growth records to ascending the global economic rankings, India’s journey over the past decade has been remarkable.
Digital Public Infrastructure (DPI)
Digital Public Infrastructure (DPI) is a transformative concept championed by India on the global stage, notably recognized in G20 deliberations by global ministers as an accelerator of global goals (UNDP, 2023). For the first time, a global coalition of twenty jurisdictions acknowledged the significance of DPI, offered a functional definition, and outlined specific guidelines and methods that may be taken into account during its creation and implementation (Chaudhuri, 2023).
DPI encompasses essential initiatives like digital identification (Aadhaar) and payment infrastructure (UPI). It embodies a transformative approach driving innovation, inclusion, and competition at scale, under open, transparent, and participatory governance. It mirrors foundational systems like the internet and telecom, ensuring global information exchange and interoperability. Simply put, DPI is a set of technology building blocks fostering digital advancement and societal progress that is going to be one of the key elements in driving India towards a USD 1 trillion digital economy by 2030 (Economic Times, 2024).
India’s journey with technology in the public domain traces back to the ’80s and ’90s, marked by disparate applications. Subsequently, infrastructure projects like state-wide area networks, Common Service Centres (CSCs), and State Data Centres (SDCs) were initiated, alongside Mission Mode Projects (MMPs), laying the groundwork for comprehensive digital infrastructure.
The inception of Aadhaar, a unique digital ID project, marked a pivotal moment in India’s digital journey. Aadhaar, offering authentication as a service, revolutionised service delivery by enabling identity verification for various transactions. Aadhaar’s success led to the development of complementary products like Digital Locker, eKYC, and e-Sign, along with the initiation of Direct Benefit Transfers (DBT), resulting in substantial government savings and efficiency gains.
A holistic understanding of DPI entails recognising its three integral layers: market, governance, and technology standards. The market layer fosters innovation through inclusive product design, while the governance layer establishes legal frameworks and public programmes to drive adoption. Technology standards, including those for identity, payments, and data sharing, ensure interoperability and the adoption of shared standards, defining DPI’s structure and functionality.
DPI strikes a balance between all-government and all-private approaches, leveraging public authority to manage frequently required services and components efficiently. By developing open protocols, shared platforms, and enabling policies, DPI creates an interoperable ecosystem, facilitating the integration of private sector innovations while ensuring public accountability and service delivery.
Security remains paramount in DPI, necessitating the establishment of secure pipelines for accessing services and robust frameworks for authentication and certification. The Aadhaar experience offers valuable insights into ensuring the safety of both infrastructure and applications. Scalability is inherent in DPI, reducing development costs and fostering a vibrant ecosystem of diverse applications.
India’s DPI success stories include Aadhaar, UPI, and CoWin, the backbone of the world’s largest vaccination program. Initiatives like the Unified Health Interface (UHI), the Ayushman Bharat Digital Mission (ABDM), and PM-WANI (providing affordable internet connectivity) reflect India’s commitment to leveraging DPI for societal benefit and inclusive growth.
India’s approach to DPI embodies scalability, interoperability, innovation, and frugality, setting a precedent for a digitally inclusive future. These are good case studies that can be replicated at scale, especially by developing countries, emerging economies, small island states, and even landlocked nations. More than a technological advancement, DPI represents a vision for societal transformation and inclusion that resonates globally. The India story of DPI serves as a testament to the nation’s dedication to harnessing technology for the greater good, inspiring nations worldwide to follow suit in fostering digital progress and inclusion.
Digital India
Launched in 2015, the Digital India programme encompasses a wide array of initiatives spanning various sectors, including infrastructure development, e-governance, digital literacy, and digital empowerment. With the vision of transforming the nation into a digitally empowered society and knowledge economy, the programme seeks to provide citizens with access to digital services, enhance efficiency and transparency in government processes, and promote digital inclusion across all sections of society.
The Digital India programme rests on several key pillars, each addressing specific aspects of India’s digital transformation: broadband highways, universal access to mobile connectivity, a public internet access programme, E-governance and service delivery, digital literacy, digital infrastructure, and the digital empowerment of citizens. Since its inception, the Digital India programme has made significant strides in advancing India’s digital transformation agenda.
- Reducing the Digital Divide: By increasing internet connectivity, Digital India has significantly contributed to the reduction of the digital divide between urban and rural areas. According to the most recent data sets available, infrastructure development—best demonstrated by the BharatNet project—has made broadband connections possible for over 1,72,000 village panchayats, enabling millions of rural Indians to use the internet for communication, education, and livelihood. When finished, this large-scale project would connect every 250,000 local gram panchayats, or 630,000 inhabited villages in India, to the internet, enabling access to ICTs through Community Development Blocks (CDB).
- The Data Revolution: In the last ten years, India has seen a revolution in the availability of reasonably priced smartphones and data plans. With 850 million broadband users as of July 2023, the nation has experienced the fastest growth in the globe, up roughly 250% from 2015. The average monthly data consumption per user in 2022 was 19.5 GB, while the monthly mobile data usage throughout India increased from 4.5 exabytes in 2018 to 14.4 exabytes in 2022. This is anticipated to quadruple by 2024 as a result of the implementation of 5G.
- Digital Payments: As a result of the Digital India initiative, there has been a notable change in the digital payments market. The adoption of systems such as the Unified Payments Interface (UPI) has transformed financial transactions and service delivery, with over 82 billion digital transactions in 2023 alone. UPI transactions exceeded INR 14.3 trillion in a single month, surpassing the total value of all digital transactions in the entire fiscal year of 2015.
- Digital Governance and Service Delivery: Digital India has revolutionised government by utilising technology to improve openness, effectiveness, and public involvement in the process of providing services. Technology-infused government procedures have improved service delivery and enabled citizen-centric governance. Platforms like DigiLocker, e-Hospital, and e-Government Procurement (GeM) have streamlined processes, cut red tape, and opened up access to necessary services for everyone. The impact of the programme was demonstrated by the fact that e-transactions pertaining to government services exceeded $3 billion in FY 2021 alone.
- Workforce Reforms and Digital Skills: Digital literacy and skill development programmes are given a lot of attention in Digital India. Millions of people, particularly in rural regions, have been empowered with crucial digital skills through programmes like the Pradhan Mantri Gramin Digital Saksharta Abhiyan (PMGDISHA), allowing them to actively participate in the digital economy. The country’s workforce has been further reinforced by the National Digital Literacy Mission (NDLM) and Skill India, which offer training in cutting-edge technology and promote entrepreneurship.
6. Financial Inclusion: Through the JAM trinity, the Digital India Programme has been instrumental in advancing financial inclusion in India. The Pradhan Mantri Jan Dhan Yojana, among other initiatives, has ensured that financial services are accessible to the poorest citizens.
Entrepreneurship and Innovation
India’s innovation ecosystem has witnessed significant growth in recent years, propelled by government initiatives and private sector participation. India is home to the third-largest startup ecosystem globally, with over 1.26 lakh startups across various sectors (Inc. 42, 2024). The government’s Startup India initiative has played a pivotal role in nurturing this ecosystem, providing startups with access to funding, mentorship, and regulatory support.
Startup India: The Startup India initiative, launched in 2016, has yielded promising results, with over 1.26 lakh startups recognised by the Department for Promotion of Industry and Internal Trade (DPIIT) and over $110 billion in investments raised by startups since its inception (Startup India, 2020; Inc42, 2024). The initiative offers various incentives, including tax exemptions, self-certification compliance, and faster patent examination, aimed at fostering a conducive environment for startups to thrive and innovate.
Atal Innovation Mission (AIM): The Atal Innovation Mission (AIM) has been instrumental in promoting innovation and entrepreneurship among students and educators. As of 2021, AIM has established over 10,000 Atal Tinkering Labs (ATLs) in schools across 35 states and union territories of India, providing over 4 million students with hands-on experience in tinkering and innovation (Jogi, 2023). Additionally, AIM’s Atal Incubation Centres (AICs) have supported over 2,000 startups, facilitating their growth and scale-up.
Research and Development (R&D) Initiatives: Investments in research and development (R&D) are crucial for driving innovation and technological advancement. India’s R&D expenditure has been steadily increasing, reaching approximately $70 billion in 2020 (World Bank, 2021). Government initiatives such as the Department of Science and Technology’s Technology Development Board (TDB) and the Council of Scientific and Industrial Research (CSIR) have been instrumental in funding and supporting R&D projects across various sectors.
Digital Innovation Hubs: Digital innovation hubs serve as collaborative spaces for startups, corporates, and investors to ideate, innovate, and co-create solutions. The Indian government’s Digital India programme has supported the establishment of over 200 incubators and accelerators, providing startups with access to infrastructure, mentorship, and funding (Digital India, 2020). These hubs have played a crucial role in fostering entrepreneurship and driving innovation across sectors.
Impact on Economic Growth: The impact of innovation and entrepreneurship on economic growth is evident in India’s startup ecosystem’s rapid expansion. According to the Economic Survey (2021), the contribution of startups to India’s GDP is expected to increase from 0.5% in 2020 to 3.5% by 2025. By 2030, Indian startups would be contributing USD 1 trillion to the Indian economy (Aggarwal, 2024).

Figure 2: Contribution of startups to Indian startups from 2020 to 2030
Startups have also been significant contributors to job creation, with over 500,000 direct jobs created by startups in 2020 alone (NASSCOM, 2020) and a total of 12.42 lakh jobs by 2023 (PIB, 2024). In the year 2022, when the world was experiencing a funding crisis, startups in India attracted funding of over USD 42 billion. The number of DPIIT-recognised startups in India was 1,26,392 as of April 10, 2024, across 763 districts of the country, as per Invest India.
Challenges and Opportunities: Despite significant progress, some challenges still remain, which include access to funding, regulatory hurdles as law always plays catch-up where disruptive industries are concerned, and talent acquisition and retention as potential employees seek tried and tested stable organisations. According to a survey by the Confederation of Indian Industry (CII), access to early-stage funding remains a primary challenge for startups, with over 60% of startups citing it as a significant barrier (CII, 2021). Addressing these challenges requires concerted efforts from policymakers, industry stakeholders, and academia to create an enabling environment for innovation and entrepreneurship to thrive.
Emerging Technologies
Democratising the Internet: The data revolution in India has been accelerated by government measures to improve digital access, especially in rural and isolated areas. The government sought to close the digital gap and give every citizen access to reasonably priced internet service through initiatives like Digital India and BharatNet. Because of the low cost of data plans, millions of Indians were able to access the internet, leading to a notable growth in internet penetration in the country. The data revolution was made possible by the democratisation of internet access, which made it possible for people and organisations to use data for a range of objectives, including government, commerce, and education.
Data Analysis: Leveraging data as a strategic asset to drive innovation and decision-making has been made possible in large part by the government’s focus on developing data analytics capabilities. The goal of initiatives like the National Data Analytics Portal (NDAP) and the National Data Sharing and Accessibility Policy (NDSAP) was to make government data more easily accessible for public service delivery, research, and innovation. These initiatives, which offer a centralised platform for data analytics and encourage cross-sector data exchange, have made it possible to build data-driven solutions to tackle complicated problems in fields like urban planning, healthcare, and agriculture.
Edge computing and quantum computing: These have the potential to be revolutionary technologies, and the government, led by the Ministry of IT and Electronics, has moved to support research and development in these fields. The goal of the National Mission on Quantum Technologies and Applications, as well as programmes like the Quantum Computing Applications Lab (QCAL), is to expedite the development of quantum computing applications and research. Analogously, initiatives to advance edge computing infrastructure—like the Edge Computing Initiative—have aimed to maximise edge computing’s potential to improve digital services’ effectiveness and performance, especially in places with poor connections.
AI and machine learning: These have become major forces behind innovation and economic growth, and the government has been instrumental in encouraging these technologies’ use and advancement. Under the National AI Mission, the Cabinet has approved an allocation of over Rs 10,300 crore for the IndiaAI Mission, marking a significant step towards bolstering India’s AI ecosystem (PIB, 2024a). To be deployed over the next five years, this financial outlay will support initiatives like the IndiaAI Compute Capacity, IndiaAI Innovation Centre (IAIC), IndiaAI Datasets Platform, IndiaAI Application Development Initiative, IndiaAI FutureSkills, IndiaAI Startup Financing, and Safe & Trusted AI (ibid.). With the Ministry of IT laying special emphasis on the IndiaAI Compute Capacity, which aims to erect a cutting-edge, scalable AI computing infrastructure by deploying over 10,000 Graphics Processing Units (GPUs) through strategic public-private collaborations. Also notable is the IndiaAI Innovation Centre (IAIC), which will emerge as a leading academic institution, ensuring streamlined implementation and retention of top research talent for the country. The IndiaAI Mission comes with a very comprehensive vision, and together, these initiatives aim to bolster India’s global leadership in AI, foster technological self-reliance, and ensure ethical and responsible AI deployment. One of the key concerns around global models has been the availability of local data sets and Indian nuances and cultural contexts. The IndiaAI Datasets Platform, will be developed by the Independent Business Division (IBD) of IndiaAI and will aim to democratise the benefits of AI across all strata of society, practising true Antodaya, serving even the last mile, and leaving no one behind (ibid.). AI is being labelled the world over as the biggest disruptor, and India will achieve a level playing field by ensuring that both in practice and policy it is able to usher in a paradigm shift.
The goal of initiatives like the AI for All programme and the National AI Strategy is to promote the adoption, development, and research of AI technology across a variety of industries. The government has aided in the development of AI firms and ecosystems by offering capital, infrastructure, and policy support. This has spurred innovation in sectors like cybersecurity, agriculture, and healthcare as well.
AI’s global market size by 2030 will be over USD 1812 billion, and by 2035, it is projected that AI will contribute approximately USD 967 billion to the Indian economy. By 2025, it is estimated to add around USD 500 billion to the nation’s gross domestic product (GDP), constituting about 10% of the country’s aim to achieve a USD 5 trillion GDP (Indian Express, 2023). There is potential to add USD 359 to 438 billion to India’s GDP on account of Gen AI adoption in 2029-30, over and above its baseline estimates (EY Report, 2023). For a country like India, AI has vast use cases across agritech, healthtech, fintech, edtech, manufacturing, and SMBs and can vastly add value to our engineering talent, marrying India’s unique strengths of culture, content, and creativity. It’s a visionary leader defining the path ahead to challenging technology that works for good.
Viksit Bharat 2047: Vision and Way Forward
With a clear focus on realising the vision of a “Viksit Bharat” (developed India) by 2047, the government has laid out a comprehensive plan aimed at empowering citizens and fostering a sustainable economy. This section outlines the key pillars and strategies envisioned to achieve this ambitious goal.
The empowerment of citizens via social welfare programmes, skill development, and education is at the core of the Viksit Bharat goal. In order to produce a qualified workforce that can spur innovation and productivity, the government wants to guarantee that everyone has access to high-quality healthcare and education. Targeted interventions will also be implemented to promote inclusive growth and development by bridging socioeconomic gaps and elevating marginalised communities.
The creation of a sustainable economy that strikes a balance between social justice, environmental preservation, and economic growth is essential to the Viksit Bharat ideal. To reduce climate change and increase resilience to environmental issues, the government will give green infrastructure, renewable energy, and sustainable agricultural methods a priority. Efforts will be made to promote responsible consumption and production patterns, ensuring the efficient use of resources and minimising environmental impact. The recent initiatives like the PM SuryaGhar Yojana, which subsidises and promotes individual rooftop solar connections, have not just seen a massive surge in registrations, but have also led to a bottom-up movement about green and clean energy amongst the citizens, where all stakeholders, including startups, are pitching in to do their bit.
India’s ability to use innovation and technology to its advantage will determine how developed the country becomes. In terms of cutting-edge technologies like artificial intelligence, quantum computing, and space exploration, India is envisioned as a worldwide leader under the Viksit Bharat vision. In order to achieve this goal, the government will fund R&D, encourage industry-academia cooperation, and establish an environment that is supportive of innovation and entrepreneurship. India wants to increase its competitiveness in the global market and promote inclusive growth by utilising technology for social and economic transformation. Moving forward, putting the initiatives in the vision paper into practice and overcoming obstacles in the way of progress will require sustained engagement with the corporate sector, foreign partners, and civil society.
The Viksit Bharat vision, which is based on the ideas of empowerment, sustainability, and innovation, offers an ambitious and aspirational development blueprint for India. India is positioned to fulfil its potential as a developed country and become a major player in the world economy in the twenty-first century by investing in its people, developing a sustainable economy, and embracing technology and teamwork.
Viksit Bharat with STRIDE
To achieve the Viksit Bharat dream, we will have to implement a STRIDE model of transformation. As senior stakeholders hold planning meetings for the next 100 day vision plan for the new government, the proposed model will be a good addition to take into ‘stride’. Figure 3 depicts the STRIDE model as it would be applicable to India’s vision of becoming a developed country. The model focuses on six priority pillars:
- S: Startups: There is a need for around 5 lakh innovative startups and supporting the growth of these startups will enable them to innovate and achieve their potential.
- T: Technology and Innovation: Emerging technology and innovation need to be leveraged to enhance productivity, efficiency, and competitiveness across industries.
- R: Research and Development: Investments will be required for research and development to foster innovation and advance scientific and technological capabilities. A fund of funds may provide a much-needed shot in the arm.
- I: Infrastructure: Pervasive world-class infrastructure will be needed to improve quality of life and deploy the best tech products and services.
- D: Deployment and adoption: Comprehensive implementation and widespread adoption of advanced solutions to transform industries and society will be required.
- E: Enhancing skills and capacity: The workforce will need to be upskilled and trained to meet the requirements of jobs in the future.

Figure 3: STRIDE model of transformation that will help India achieve the 2047 Viksit Bharat vision by Dr. Subi Chaturvedi
In order to realise the goal of a Viksit Bharat by 2047, a comprehensive plan for revolutionary development is offered through the STRIDE model. By promoting both economic growth and the general well-being of our citizens, this integrated approach would pave the way for India’s ascent to prominence in the world economy by 2047, where both development and growth go hand in hand, taking inspiration and being propelled from the Prime Minister’s Panch Pran which include, above all, throwing away the subservient, conformist mindset, asking the right questions, leaving the baggage from the past behind while learning from history, embracing tradition with modernity, and dreaming to our fullest potential while doing right by our nation, putting our fellow Indians first and our country above all.
Author Brief Bio: Dr Subi Chaturvedi, is a distinguished public policy professional, an AI tech policy expert, and a former member of the United Nations Internet Governance Forum, MAG. She is currently the Global SVP, Chief Corporate Affairs & Public Policy Officer, InMobi and FICCI Chair Women in Technology, Policy & Leadership.
References:
Aggarwal, R. (2024). Indian startups may add $1 trillion to Indian economy by FY30: CII report. Business Standard. (Retrieved from https://www.business-standard.com/companies/start-ups/indian-startups-may-add-1-trillion-to-indian-economy-by-fy30-cii-report-124031400950_1.html on 20 March 2024.
Armstrong, M. (2022). This chart shows the growth of India’s economy. World Economic Forum. Retrieved from https://www.weforum.org/agenda/2022/09/india-uk-fifth-largest-economy-world/ on 19 March 2024.
Chaudhuri, R. (2023). Decoding the G20 Consensus on Digital Public Infrastructure: A Key Outcome of India’s Presidency. Carnegie India. Retrieved from https://carnegieindia.org/2023/09/01/decoding-g20-consensus-on-digital-public-infrastructure-key-outcome-of-india-s-presidency-pub-90467 on 16 March 2023.
Economic Times (2023). Budget 2024: FM Sitharaman outlines top 10 achievements of Modi government in 10 years. Economic Times. Retrieved from https://economictimes.indiatimes.com/news/economy/policy/budget-2024-narendra-modi-as-pm-top-10-achievements-of-india-central-government-bharatiya-janata-party-from-2014-to-2024/articleshow/107311704.cms?utm_source=contentofinterest&utm_medium=text&utm_campaign=cppst on 18 March 2024.
EY Report (2023). The AIdea of India Generative AI’s potential to accelerate India’s digital transformation. Available as PDF at https://assets.ey.com/content/dam/ey-sites/ey-com/en_in/topics/gen-ai/2023/12/ey-the-aidea-of-india-generative-ai-s-potential-to-accelerate-india-s-digital-transformation.pdf
Gupta, P. and Blum, F. (2018). India’s remarkably robust and resilient growth story. Retrieved from https://blogs.worldbank.org/en/endpovertyinsouthasia/india-s-remarkably-robust-and-resilient-growth-story on 20 march 2024.
INC42 (2024). India’s Unicorn Club: Here’s The Comprehensive List Of 100+ Unicorns In India. Retrieved from https://inc42.com/features/indias-unicorn-club-the-comprehensive-list-of-unicorns-in-india/ on 20 March 2024.
Indian Express (2023). Artificial intelligence expected to add $500 billion to India’s GDP by 2025: Report. Retrieved from https://indianexpress.com/article/business/economy/artificial-intelligence-expected-to-add-500-bn-to-india-gdp-by-2025-8507775/ on 21 March 2024.
Jogi, N. (2023). 10,000 Atal Tinkering Labs in Indian schools: What they are, and their purpose. Money Control. Retrieved from https://www.moneycontrol.com/news/education/10000-atal-tinkering-labs-in-indian-schools-what-they-are-and-their-purpose-11916991.html on 18 March 2024.
Majumdar, D. (2024). India leads in salary growth projections in APAC; these sectors will give higher hikes this year. The Economic Times. Retrieved from https://economictimes.indiatimes.com/jobs/hr-policies-trends/india-leads-in-salary-growth-projections-in-apac-these-sectors-will-give-higher-hikes-this-year/articleshow/107880129.cms?utm_source=contentofinterest&utm_medium=text&utm_campaign=cppst on 15 March 2024.
Pandit, A. (2023). 415 million people exited poverty in India in 15 years: UN Report. The Times of India. Retrieved from http://timesofindia.indiatimes.com/articleshow/101678289.cms?utm_source=contentofinterest&utm_medium=text&utm_campaign=cppst on 20 March 2024.
PIB (2024). DPIIT recognises 1, 17,254 startups as on 31st Dec 2023. Retrieved from https://pib.gov.in/PressReleaseIframePage.aspx?PRID=2002100#:~:text=For%20attaining%20speci%EF%AC%81c%20objectives%2C%20various,as%20on%2031st%20December%202023 on 21 March 2024
PIB (2024a). Cabinet Approves Over Rs 10,300 Crore for IndiaAI Mission, will Empower AI Startups and Expand Compute Infrastructure Access. Retrieved from https://pib.gov.in/PressReleasePage.aspx?PRID=2012375#:~:text=The%20Cabinet%20has%20approved%20an,towards%20bolstering%20India’s%20AI%20ecosystem on 24 March 2024
PTI (2023). Jan Dhan Yojana revolutionised financial inclusion in India, more than 50 cr bank a/cs opened: FM. The Hindu. Retrieved from https://www.thehindu.com/news/national/jan-dhan-yojana-revolutionised-financial-inclusion-in-india-more-than-50-cr-bank-acs-opened-fm/article67243739.ece on 18 March 2024.
PTI (2024). India continues to be preferred destination for FDI, says Piyush Goyal. Business Standard. Retrieved from https://www.business-standard.com/economy/news/india-continues-to-be-preferred-destination-for-fdi-says-piyush-goyal-124020901406_1.html on 19 March 2024
World Bank. (2024). World Development Indicators Database. Retrieved from https://databank.worldbank.org/source/world-development-indicators on 20 March 2024