
Introduction: From Connected Infrastructure to Dynamic Mobility
The journey towards Viksit Bharat@2047 is as much about improving the productivity of national assets as it is about creating new ones. The Sapt Dhara vision identifies seven streams of national development. Two of these, Technology and Innovation and ‘GatiShakti’, are closely linked. Technology and Innovation brings capabilities in artificial intelligence, space technology, advanced analytics, digital systems, and other emerging technologies, while Gati Shakti focuses on seamless connectivity through modern infrastructure and multimodal logistics.[1]
The PM GatiShakti National Master Plan operationalises this infrastructure vision. It brings together seven engines comprising Roads, Railways, Ports, Waterways, Airports, Mass Transport and Logistics Infrastructure, within a common planning framework. While the seven streams of Sapt Dhara and the seven engines of PM GatiShakti are separate constructs, the parallel is useful. One represents broad development pathways for Viksit Bharat, while the other provides much of the physical connectivity through which people, goods and economic activity move.[2]
Equally important are the six principles of PM GatiShakti: comprehensiveness, prioritisation, optimisation, synchronisation, analytical capability, and dynamism. Comprehensiveness brings together information from different sectors. Prioritisation helps determine which gaps or interventions should be addressed first. Optimisation identifies better routes, modes, and project alternatives. Synchronisation seeks to prevent infrastructure agencies from planning in isolation. Analytical capability improves the evidence available to decision-makers, while dynamism recognises that plans and conditions are constantly changing.[3]
The mobility opportunity this paper addresses lies at the intersection of analytical capability and dynamism. PM GatiShakti already provides a powerful spatial view of infrastructure, economic nodes and their relationships. Logistics gives much of this connectivity its economic purpose by moving raw materials, finished goods and services efficiently between origins, production centres, markets and gateways. Mobility extends the same idea to people, not just goods. A spatial platform can show where a road, railway, port, airport or logistics node is located. It can identify missing links, analyse proximity and assist with route selection. Yet infrastructure is ultimately built to enable movement. Its performance therefore depends not only on where it exists, but also on how it is used over time.
This raises a different set of questions. Where does travel demand originate? Where is it headed? When does it peak? Which routes and modes are used? How long do people stay at major destinations? Where is congestion emerging? Is capacity available on an alternative mode? What happens when weather, a major event or new economic activity suddenly changes demand? Road congestion shows why this matters. TomTom’s 2025 Traffic Index estimates annual rush-hour time lost at 104 hours in New Delhi, 126 hours in Mumbai, 152 hours in Pune and 168 hours in Bengaluru. Behind these numbers are lost productive time, additional fuel use, uncertain journey times and pressure on both road and public-transport systems.[4] So the next step is to complement the spatial foundation of infrastructure with the temporal dimension of movement.
Bharat Mobility Intelligence is not proposed as a new standalone government platform, but as a decision-support approach that strengthens the existing GatiShakti framework by linking infrastructure to actual mobility demand and to network performance.
From Spatial Foundation to a Mobility Digital Twin
To move from spatial infrastructure planning to dynamic mobility management, five complementary layers need to be integrated within a common spatial and temporal framework.
- The mobility plan begins with the geometric layer, which identifies where movement can occur. A reliable mobility model requires an accurate representation of the physical network, including road alignments, carriageways, intersections, flyovers, underpasses, access points, stations, terminals, car parks, and other constraints. High-resolution satellite imagery, mobile mapping, LiDAR, and street-level imagery can provide details such as road width, lane configuration, gradients, surrounding buildings, and transport assets. Indian companies already possess capabilities in mobile LiDAR, 360-degree panoramic imagery, and three-dimensional urban mapping.[5]
- The second layer concerns vehicle movement. GPS probes, connected fleets, sensors and public-transport systems can be referenced to the road network to estimate speed, travel time, trajectories, congestion and route choice.
- A third layer concerns population movement. Mobile networks generate location-related network events during normal service delivery. When processed with appropriate safeguards and aggregated spatially and temporally, such observations can provide useful indications of population presence and movement. Research has demonstrated their value in identifying broad mobility patterns and estimating origin-destination flows.[6] Their planning value lies not in tracking individuals, but in understanding aggregated measures such as population presence, broad origins and destinations, arrival and departure patterns, dwell duration, and changes in movement throughout the day. Understanding where mobility demand originates and where it goes is important. GPS and telecom-derived information are therefore complementary. GPS provides a strong view of network and vehicle behaviour. Aggregated telecom information can provide a broader indication of population distribution and movement.
- A fourth layer represents the multimodal system itself, comprising roads, metro, railways, buses, airports, taxis, parking, freight facilities, and interchange points.
- The final, fifth layer is context. Weather, events, road incidents, construction, land use, employment centres, commercial districts and seasonal patterns all influence movement.
When these elements connect through location and time, they form the basis of a Mobility Digital Twin. A Mobility Digital Twin should not be viewed merely as a three-dimensional representation of roads and buildings. Its real value lies in capturing interactions among infrastructure, people, vehicles, transport capacity, context, and time. For example, GPS may show that a corridor has suddenly slowed. Aggregated movement patterns may indicate an unusual increase in demand from a particular part of the city. The spatial model may reveal a constrained junction. Public-transport information may show spare capacity on a parallel metro corridor, while weather data may show that another route has become unreliable.
Viewed independently, these are separate observations. When linked by location and time, they provide the basis for understanding the problem and considering alternatives. These components become far more valuable when integrated within a common spatial and temporal framework. Figure 1 illustrates how the Mobility Digital Twin brings together the physical network, vehicle movement, population movement, multimodal transport and contextual information, and then supports GeoAI-based prediction, scenario evaluation, decision support and approved action.
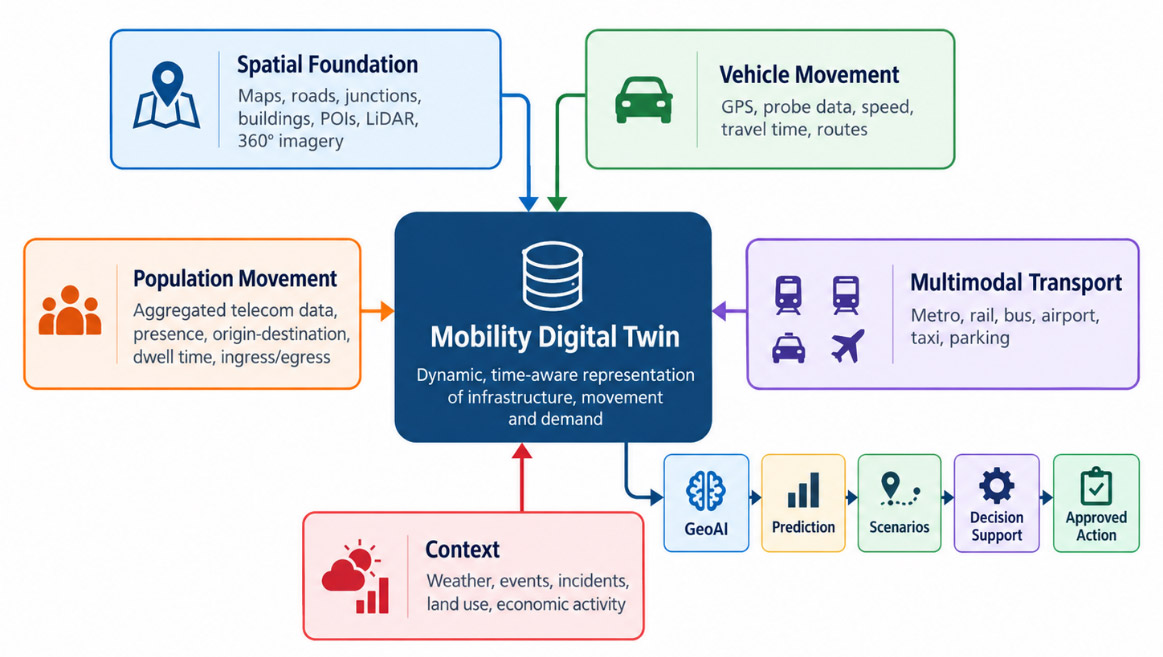
Figure 1. Mobility Digital Twin: Integrating Infrastructure, Movement and Time
Source: Author’s conceptualisation.
From Information to Decisions
Once the physical and dynamic layers are connected, mobility planning can proceed logically.
- Geometric: Where can movement occur?
The system establishes the physical network within which mobility occurs.
- Informative: What is happening now?
Current speed, congestion, incidents, public-transport conditions and population concentrations provide situational awareness.
- Predictive: What is likely to happen next, and what factors are driving this?
Historical and current observations can identify recurring bottlenecks, abnormal demand, weather effects and emerging pressure on specific corridors.
- Prescriptive: What can we do?
Instead of merely forecasting a problem, models can compare interventions such as signal changes, diversions, additional buses, increased metro frequency, parking controls, pick-up zones, or infrastructure improvements.
- Agentic: Can the system assemble the evidence and evaluate alternatives?
An authorised AI agent can start with an objective, determine which permitted information is required, invoke relevant analytical models, and compare alternative responses.
- Bounded autonomous operation: Can approved actions be executed and adapted to?
Certain predefined, low-risk operational actions may be carried out within authorised limits. Adaptive traffic signals provide one example: where an intervention can be implemented, its effect measured, and the action maintained, modified, or reversed.
As shown in Figure 2, the system progresses from understanding the network geometry to describing current conditions, anticipating future states, evaluating interventions, aggregating evidence through agentic AI, and, finally, supporting bounded autonomous action within defined operational limits.
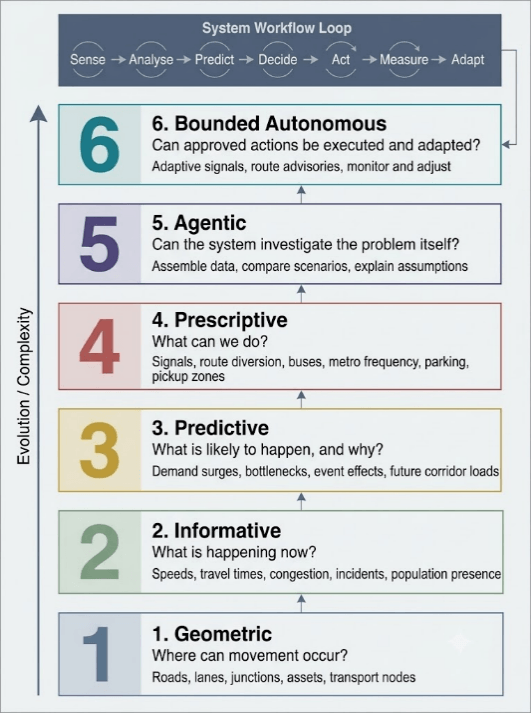
Figure 2. From Geometric Representation to Bounded Autonomous Mobility Management
Where Dynamic Mobility Adds Value
- Airports and Railway Stations
An airport may know its passenger footfall accurately. Yet footfall alone does not explain the airport’s relationship with the city. Transport planning benefits from knowing which broad parts of the metropolitan region passengers and visitors come from, when they arrive, how long they remain in the airport zone, and where subsequent arrivals disperse. That information can then be compared with road access, metro corridors, buses, taxis, parking, and pick-up/drop-off capacity. The same principle applies to major railway stations. This shifts the planning problem from simply counting passengers at a terminal to understanding its catchment, timing, and the onward distribution of demand. If substantial airport-related movement repeatedly originates from a particular corridor, the response may be a stronger metro connection, express bus service, better interchange, or improved road access. Dwell time offers another perspective. If passengers consistently arrive well ahead of schedule, one possible explanation may be uncertainty about surface travel time. The observation does not establish the cause, but it provides a useful planning signal that can be tested against other data.
- Multimodal Urban Movement
Suppose a large volume of morning movement occurs between two parts of a city. A road-only analysis may suggest adding road capacity. A multimodal analysis may show that a nearby metro or suburban rail corridor has spare capacity but poor feeder connectivity. In such a case, widening the road may not be the best intervention. It may be an improved interchange, additional feeder buses, or stronger first- and last-mile connectivity. This directly supports GatiShakti’s principles of optimisation and synchronisation.
- Event Mobility
A stadium provides an especially useful example of how time changes mobility. A venue accommodating 50,000 or 60,000 spectators may receive its audience gradually over three or four hours. The surrounding transport network can often absorb this accumulation. When the event ends, a large share of the same population may try to leave within thirty to forty-five minutes. The people have not changed. The infrastructure has not changed. Time has changed the mobility problem. Before the event finishes, the city can analyse aggregated population presence, broad catchment areas, historical dispersal patterns, current road conditions, metro and bus capacity, parking, and weather together. The city can then prepare the return movement in advance: increasing metro frequency, positioning temporary buses, staging parking exits, identifying taxi pickup areas, modifying signal plans and communicating alternative routes.
The same logic applies to exhibitions, festivals, religious gatherings and other large events. Political rallies and protests can also create temporary transport and emergency-management pressures. In such sensitive contexts, analysis should be limited to aggregated crowd movement, transport planning, emergency access and public safety. It should not be used to identify individuals, infer political affiliation or reconstruct personal journeys.
Event mobility shows that time is as important as location. A crowd may build up gradually over several hours but disperse within a much shorter period, creating a temporary demand shock across roads, metro, buses, taxis and parking systems. Figure 3 illustrates this asymmetry and the need for coordinated multimodal planning.
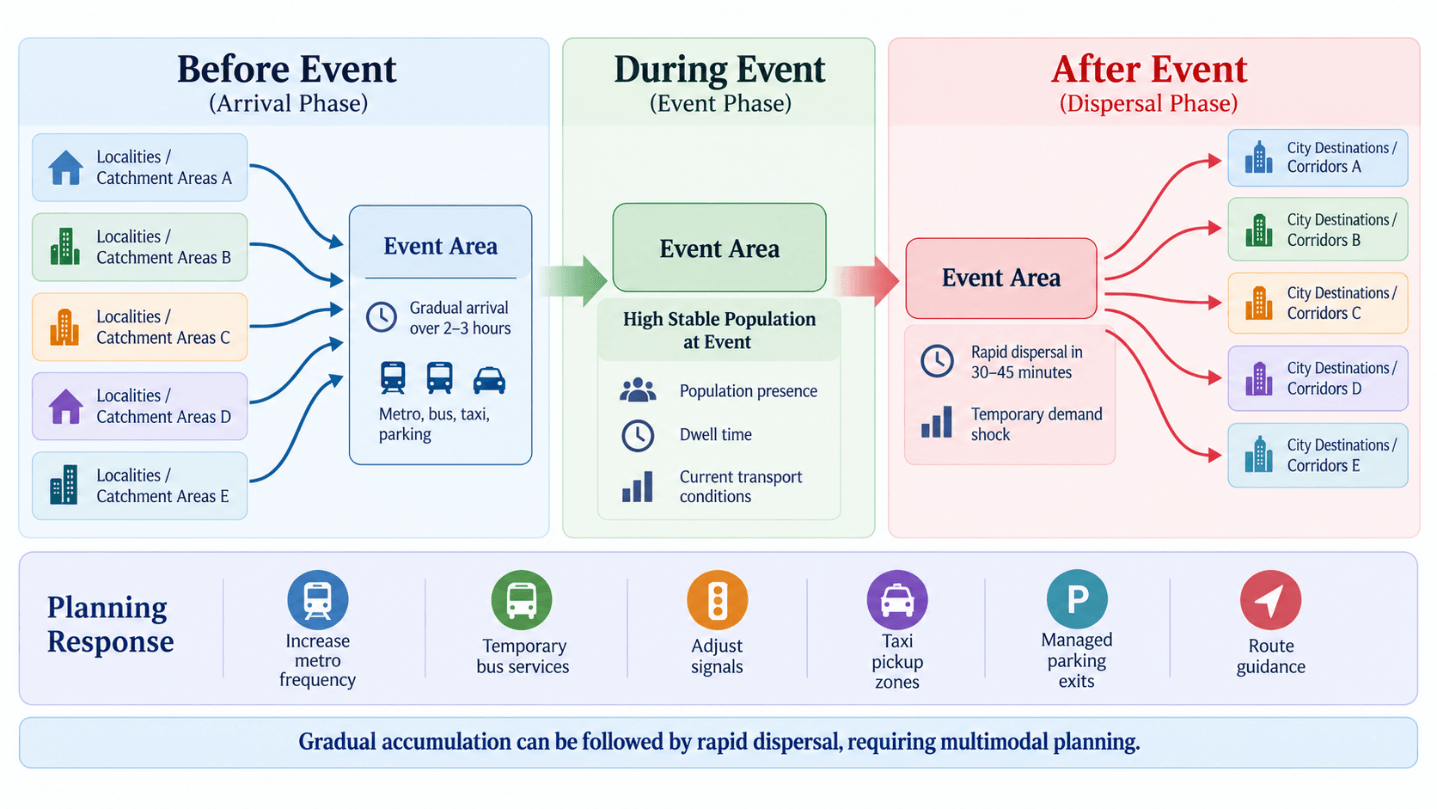
Figure 3. Event Mobility – Gradual Arrival and Rapid Dispersal
From Prediction to Better Decisions
The Mobility Digital Twin’s value increases when conditions interact. Consider a large event scheduled to finish at 10:30 p.m. Heavy rainfall is expected, and sections of the surrounding network are known to be vulnerable to waterlogging. A conventional dashboard may show congestion only after it develops. A more advanced system can combine rainfall forecasts, waterlogging susceptibility, current road speeds, population presence, previous origin-destination patterns, road geometry and available public-transport capacity.
Several alternatives can then be tested, including additional metro services, temporary buses, adjusted signal timing, traffic diversion, managed taxi zones, or combinations of these measures. The decision-maker receives scenarios, not just an alert.
- Which alternative reduces the number of person-hours most?
- Which requires the least additional capacity?
- Which avoids transferring congestion to an adjacent corridor?
- Which provides the best result at reasonable cost?
GeoAI can support this progression by detecting patterns, estimating demand, predicting congestion and comparing scenarios. International work on AI-enabled urban mobility also identifies Digital Twins, transport simulation, predictive scheduling and multimodal planning as key emerging capabilities.[7]
Agentic AI takes it a step further. “Prepare the most effective dispersal plan for tonight’s stadium event.” An authorised agent could identify relevant data, verify its freshness, invoke predefined models and compare alternatives. The recommendation should remain explainable. A decision-maker should know which data was used, what assumptions were made, which options were tested and how confident the system is in its conclusion.
This makes counterfactual planning practical and helps answer questions such as: What happens if nothing is done? What changes if metro frequency increases? What if signals are modified? What happens if both actions are combined? AI is therefore most useful when it shortens the distance between evidence and an informed decision, rather than replacing human judgement.
Measuring the Outcome: A Delhi Illustration
The benefits of mobility technology should ultimately be measurable. One useful metric is the reduction in vehicle-and person-hours lost. Fuel consumption is another. Researchers from the CSIR-Central Road Research Institute (CRRI) studied vehicle idling at signalised intersections in Delhi. Testing 341 representative vehicles and extrapolating the observations to approximately 950 signalised intersections, the study estimated daily losses of 9,036 litres of petrol, diesel and LPG combined and 5,461 kilograms of CNG, together with approximately 37 tonnes of CO2-equivalent emissions.[8] The significance of the study is not that these historic numbers should be treated as a current estimate of all Delhi congestion. Rather, it shows that avoidable delay can translate into measurable economic and environmental effects.
Fuel Saved = Sum (N_i x DeltaT_i x R_i), where N_i is the number of affected vehicles, DeltaT_i is the reduction in avoidable delay, and R_i is the relevant fuel-consumption rate.
A related CRRI experiment across Indian cities reported indicative average idling consumption of approximately 0.14 litres/hour for motorcycles, 0.24 litres/hour for three-wheelers, 0.6 litres/hour for cars and 0.9 litres/hour for buses.[9] For example, eliminating 50,000 car-equivalent idling hours at an indicative 0.6 litres/hour would correspond to around 30,000 litres of avoided fuel consumption.
A rigorous city-level estimate would require actual fleet composition, electric-vehicle penetration, fuel types, traffic conditions, and observed before-and-after conditions. More importantly, the system should answer: Did vehicle hours fall? Did person-hours fall? Did bus speed improve? Was fuel saved? Did congestion disappear, or simply move elsewhere? This closes the loop between analysis and infrastructure productivity.
From Vision to Delivery
Technology alone will not deliver Bharat Mobility Intelligence. The first requirement is a common data and standards framework. Road segments, geographic zones, origin-destination measures, dwell time and temporal aggregation require consistent definitions across participating agencies.
The second is interoperability through a federated architecture. Every participant need not transfer raw data to a common repository. Telecom operators, transport agencies and other lawful custodians can retain sensitive information in controlled environments while providing authorised, aggregated indicators or analytical services.
The third requirement is institutional partnership. Mobility spans administrative boundaries. Central and State governments, urban local bodies, transport agencies, telecom operators, mapping companies, public-transport providers, AI companies and academic institutions each hold part of the solution. Independent academic validation can be particularly valuable for evaluating models and outcomes.
The fourth is a phased implementation focused on measurable problems. Rather than beginning with a nationwide technology rollout, selected cities, transport corridors, airports, railway stations or major event districts can serve as demonstrators. Each pilot should begin with a clear objective, such as reducing delays, improving bus speeds, increasing public-transport utilisation, improving airport accessibility or reducing avoidable fuel consumption.
Procurement should progressively measure not only whether a technology platform was delivered, but also whether mobility actually improved. That shift moves the emphasis from technology deployment to public value.
Trust, Sovereignty and Responsible Data Use
Telecom-derived mobility can create significant public value, but only within a clear framework of trust. India’s Digital Personal Data Protection Act, 2023, and the Digital Personal Data Protection Rules, 2025, provide the broader legal context for processing digital personal data. Mobility applications should therefore embed aggregation, data minimisation, purpose limitation, controlled access, security, retention limits, and auditability in their design.[10] A transport planner does not need to ask where a particular subscriber travelled. The useful question is how many journeys occurred between Zone A and Zone B during a defined period, how unusual that flow was, and what transport capacity was available. This distinction is fundamental.
There is also an Atmanirbhar Bharat dimension. India should maintain robust domestic capabilities in Earth observation, mapping, mobile mapping, telecommunications, Digital Twins, AI models and transport platforms. Open standards can support interoperability. Open datasets, where appropriate, can broaden participation by researchers, start-ups and public agencies. Open-source technologies can support experimentation and reduce unnecessary dependence on proprietary systems. Atmanirbhar, or self-reliance, in this context does not mean isolation. It means retaining the ability to build, understand, operate, audit and govern technologies that are important to national infrastructure.
Conclusion: Mobility as a GatiShakti Outcome
PM GatiShakti has established a robust spatial and institutional foundation for integrated infrastructure planning. Its seven engines define the major networks through which people and goods move, while its six principles provide the discipline for planning and coordination. Bharat Mobility Intelligence fits naturally within this framework, particularly in the principles of analytical capability and dynamism, and strengthens optimisation and synchronisation across modes.
Geometry tells us where movement can occur. Dynamic observations tell us what is happening. Prediction helps anticipate what may happen next. Prescription compares possible responses. Agentic systems can assemble evidence and evaluate alternatives, while bounded autonomy can support approved operational action and measure its effect. The Mobility Digital Twin provides a common environment where these capabilities can work together.
For Viksit Bharat@2047, India will continue to build highways, railways, metros, airports, ports and logistics infrastructure at scale. The next productivity gain will increasingly depend on how well these assets work together and how closely capacity aligns with actual movement. Bharat Mobility Intelligence is therefore not technology for its own sake. It is a means to improve infrastructure utilisation, reduce avoidable travel time, conserve fuel, strengthen multimodal connectivity and make planning more responsive to real demand. The ultimate measure of GatiShakti is not only how much infrastructure Bharat builds, but also how intelligently that infrastructure enables Bharat to move.
Author Brief Bio: Dr Aniruddha Roy is Chief Innovation Officer at Genesys International and a geospatial technology leader with over three decades of experience in GIS, advanced mapping, GeoAI, LiDAR and Digital Twins. An alumnus of IIT Roorkee and IIT (ISM) Dhanbad, and a former researcher at CSRE, IIT Bombay, he holds a Ph.D. in Environmental Science and Engineering and an MBA in Disaster Management. He has contributed to major national geospatial initiatives, including the National Spatial Data Infrastructure (NSDI) India; serves on BIS and ISO technical committees; and has held leadership roles with FICCI’s Geospatial Technologies Committee and its Space and Geospatial Committee.
References:
[1] Prime Minister’s Office, Government of India, “PM’s Address from the Ramparts of Red Fort on the Occasion of 80th Independence Day,” 15 August 2026. The address identifies Technology and Innovation as the third stream of Sapt Dhara and Gati Shakti as the fourth.
[2] PM GatiShakti National Master Plan, Government of India, “About PM GatiShakti,” accessed 8 October 2026. The framework identifies seven engines: Railways, Roads, Ports, Waterways, Airports, Mass Transport and Logistics Infrastructure.
[3] PM GatiShakti National Master Plan, Government of India, “National Master Plan,” accessed 8 October 2026. The six principles are comprehensiveness, prioritisation, optimisation, synchronisation, analytical capability and dynamism.
[4] TomTom, “India Traffic Index 2025,” accessed 8 October 2026.
[5] Genesys International Corporation Ltd., “LiDAR Engineering,” accessed 8 October 2026.
[6] Marta C. González, César A. Hidalgo, and Albert-László Barabási, “Understanding Individual Human Mobility Patterns,” Nature 453 (2008): 779–82, https://doi.org/10.1038/nature06958; Francesco Calabrese et al., “Estimating Origin-Destination Flows Using Mobile Phone Location Data,” IEEE Pervasive Computing 10, no. 4 (2011): 36–44, https://doi.org/10.1109/MPRV.2011.41.
[7] International Telecommunication Union, AI-Enabled Citiverse: Use Cases for Cities in the Age of AI—Transport and Mobility (Geneva: International Telecommunication Union, 2026).
[8] Niraj Sharma et al., “Idling Fuel Consumption and Emissions of Air Pollutants at Selected Signalized Intersections in Delhi,” Journal of Cleaner Production 212 (2019): 8–21, https://doi.org/10.1016/j.jclepro.2018.11.275.
[9] P. V. Pradeep Kumar et al., “Evaluation of Idling Fuel Consumption of Vehicles across Different Cities” (paper presented at Recent Advances in Traffic Engineering [RATE 2015], Sardar Vallabhbhai National Institute of Technology, Surat, July 2015).
[10] Digital Personal Data Protection Act, 2023, No. 22 of 2023 (India); Ministry of Electronics and Information Technology, Government of India, Digital Personal Data Protection Rules, 2025, notified 14 November 2025.