India-US Indo-Pacific Track 2 Dialogue Kauai, Hawai’i, June 24-25

The Pacific Forum and the India Foundation jointly convened the first iteration of the US-India Indo-Pacific Dialogue on the island of Kauai, Hawai’i on June 24-25, 2024. Over two days, participants discussed broad thematic issues and delved deeper into perennial challenges in the bilateral partnership and cooperation opportunities. The US Representative from Hawai’i’s First District, Ed Case, delivered keynote remarks on the first day of the dialogue. In the first session, Dr Ram Madhav, President, India Foundation and leader of the Indian Delegation and Dr David Santoro, President & CEO, Pacific Forum explained the purpose of the dialogue and rationale for having, in alternate years, a session in the Pacific Ocean (in Hawai’i) and a dialogue session in the Indian Ocean, in an Indian Ocean city; the next session will take place in India in early 2025. In a nutshell, there is an urgent need to build a new, professional, and especially outcome-oriented US-India relationship, one liberated from old, outdated reflexes and stigmas, and it is particularly important to reflect on and identify what the two countries can and should achieve in the Indo-Pacific, the world’s new centre of gravity.
Both leaders unanimously emphasized the importance of the following:
- US-India expanded cooperation in conventional security spheres and non-traditional security threats, such as technology, supply chains, and disaster relief efforts.
- Expanded and increased cooperation in third countries or regions, such as Pacific Islands and Indian Ocean islands.
- Reimagining the purpose of the Quad and its role in the region, including the scope for other mini-laterals and groupings. Concepts such as “heteropolar” emphasized the role of non-state actors in the shaping of world affairs. New trilaterals with Japan and Korea were singled out as having significant potential.
- Cold-War era relationships continue to play spoilsport, while not totally derailing the partnership. Minor blips occasionally surface in the relationship, and track-2 efforts have not sufficiently addressed them, even as top-level government-to-government diplomatic talks have worked hard to recenter the partnership. The need for new and expanded track-2 initiatives has become vital and topical.
- Both leaders advocated increased and coordinated engagement in the Indian and Pacific Ocean regions. There was emphasis on respecting existing relationships of the two nations in their supposed spheres of influence, i.e., the United States in the Pacific and India in the Indian Ocean.
The second session of the dialogue focussed on “U.S.-India Cooperation in the Pacific”. In the third session, “New Frontiers and New Challenges,” the focus was US-India technology cooperation, such as iCET and other multilateral cooperation mechanisms. The discussion focused on biotechnology, semiconductors, and advanced telecommunications. There needs to be a common understanding of terrorism and security threats in the Indo-Pacific; divergences in the designation of groups as terrorist (and not) could complicate the US-India relationship in the long term, even perhaps in the near term which was widely discussed in the fourth session on “Security Cooperation in the Pacific and Beyond”.
The fifth session on “US-India Relations in the Media” focused on the bilateral relationship’s engagement at the track-2 level in which the key takeaway was that there is a mismatch in approaches to the US-India partnership between track-1 and track-2. The former is generally enthusiastic and forward-leaning about the partnership, whereas the latter tends to be negative and, by and large, sceptical about further progress. On the Indian side, Charge d’affaires, Amb. Sripriya Ranganathan delivered her remarks on the second day, referencing the expanded cooperation between the United States and India in multiple areas, as well as with other regional partners.
In the final session, participants discussed the next steps for US-India engagement.
- While the two-day discussion covered several key aspects of the bilateral relationship, there was no dedicated engagement on climate change cooperation in the Indo-Pacific, or people-to-people ties. This is a gap that the next dialogue iteration should plug.
- The next dialogue iteration should have increased participation from development financing institutions, such as DFC, Asian Development Bank (ADB), and other multilateral institutions and representatives from the private sector.
- There was a consensus about bringing third nations as observers to the bilateral dialogue to increase awareness and enhance the discussion. It appeared especially important to do so in the Indian Ocean context.
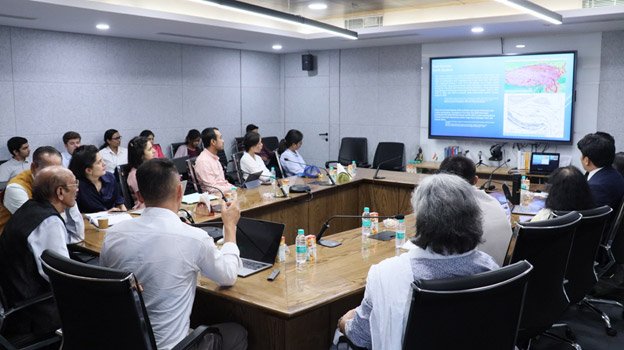
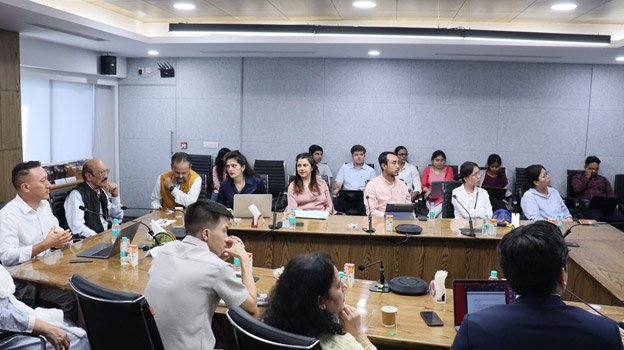
The Elaboration of the North-South Transport Corridor: Concept and Its Implementation
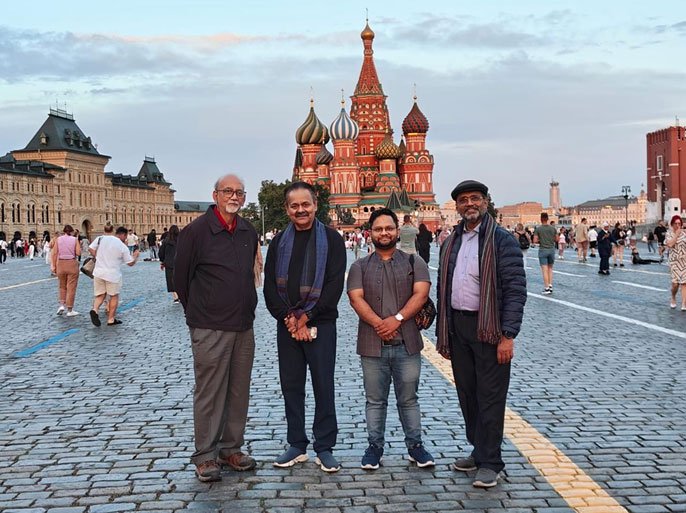
India Foundation delegation, led by Vice Admiral Shekhar Sinha, Chairman of the Board of Trustees, India Foundation and included, Captain Alok Bansal, Director, India Foundation, Shri DP Srivastava, Former Ambassador of
India to the Islamic Republic of Iran and Dr Pavan Chaurasia, Research Fellow, India Foundation participated in a two-day trilateral conference titled “The Elaboration of the North-South Transport Corridor: Concept and Its Implementation.” The conference took place from June 20-21, 2024, in Moscow, Russia and was organized by Institute of Scientific Information for Social Sciences of the Russian Academy of Sciences (INION RAS), a leading think tank based in Moscow, Russia in collaboration with India Foundation and included delegates from Institute for Political and International Studies (IPIS), Iran. The first day commenced with the welcome remarks from Prof Alexey V. Kuznetsov, a corresponding member of INION RAS, and Dr Ali Chegeni, the head of the Iranian delegation. On behalf of India Foundation, Captain Alok Bansal expressed gratitude to INION for organizing the conference and managing the logistics. He conveyed optimism that the discussions would yield meaningful results and a framework beneficial to the future of the North-South Transport Corridor.
In the first session, Vice Admiral Shekhar Sinha spoke on the theme “Security Dynamics of Transport Corridor with Special Focus on INSTC.” He underscored the importance of addressing the security impediments to ensure the success of the transport corridor. Vice Admiral laid emphasis on the fact that various risks—including illegal migration, narcotics trafficking, piracy, substandard vehicles, and proliferation—must not be overlooked. Several solutions to mitigate these security threats were also proposed.
Ambassador DP Srivastava gave a presentation on the topic of “Russia, Central Asia, and the International North-South Transport Corridor (INSTC).” He underscored the numerous advantages associated with the INSTC, including, among others, a reduction in costs due to shorter distances and expedited deliveries, enhanced market access leading to the emergence of new markets, the establishment of regional supply chains across Eurasia, as well as the formulation of regional free trade agreements (FTAs).
On the second day of the conference, Captain Alok Bansal delivered a compelling presentation on the topic “Significance of Chabahar Port for India and Feasibility of its Linkage with INSTC”. In his presentation, he mentioned that the need for the International North-South Transport Corridor (INSTC) was framed as driven more by geopolitical considerations than geographical ones. Collaboration among participant nations was emphasized as essential for the corridor’s success, along with the necessity of a strong political will. India’s stance against China’s Belt and Road Initiative (BRI) was articulated, citing violations of its sovereignty and unaddressed concerns regarding its implications.
The Russian delegation highlighted that INSTC is a win-win for all the three parties and that it has a historic aspect that dates back from fifteenth century about the route from Damascus to Basra to India. It was emphasised that the Bandar Abbas port in Iran, which was being developed is a very critical component of INSTC and it is necessary to construct a railway line to the port for the goods to be carried. It was also mentioned that Azerbaijan could become a key element for the success of INSTC as it serves as a strategic transit hub within the INSTC framework and that its location allows for the facilitation of trade routes connecting the Caspian Sea to the Persian Gulf and further into Europe.
The Iranian delegation intensively delved into the topic of INSTC and Chabahar port. In one of the presentations made by the Iranian delegation, it was mentioned that there were three major corridors that connected Asia to Europe namely The Silk Road Economic Belt, the Trans-Siberian Railway and The Northern Sea Route. However, after the Russia-Ukraine conflict, middle corridors have become much more important and therefore the world has seen a surge in the development of middle corridors. It was argued that there are certain lessons that need to be drawn from the present context, most importantly being that mini-lateralism between India, Russia and Iran can work wonders, of which INSTC is a glaring example.
Apart from this, various topics like trade, banking, maritime security, connectivity were also discussed in the conference. The perspectives of all the three participating delegations on different issues were brought about by the speakers in different sessions. The conference concluded with all sides expressing confidence to carry forward these discussions and holding the next one very soon.
China-India New Economy Dialogue

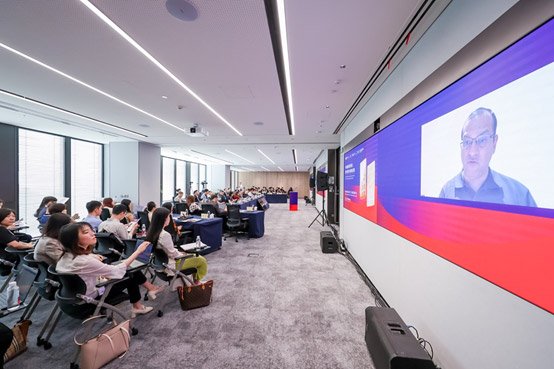
“China-India New Economy Dialogue” was successfully held in Beijing, China, on June 22nd, 2024. The Forum was co-sponsored by institutions from both China and India, including The Institute for International Affairs (IIA), Qianhai of the Chinese University of Hong Kong, Shenzhen; Tsinghua Symposium; The Institute for Digital Economy & Artificial Systems (IDEAS BRICS); CICC Global Institute; Center for East Asian Studies of Jawaharlal Nehru University (JNU); and India Foundation. More than 100 attendees from the public and private sectors participated in the forum either in person or virtually.
The Forum focused on in-depth discussions on macroeconomics, trade relations, and cooperation between China and India. Nearly 20 speakers from both countries participated. The welcome address was delivered by Shri Shaurya Doval, Member, Governing Council, India Foundation. During the keynote speech, Siddharth Tiwari (from Advisory Council of Bretton Woods Committee), Yongnian ZHENG (from IIA) and Alka Acharya (from JNU) represented the opportunities and challenges for China, India and the world. Roundtable session discussed on the current situation and challenges for China-India economic and trade relations. In the afternoon, prominent guests from both China and India shared their insights and suggestions on the development of industries in Dialogue on Digital Economy and Dialogue on Green Development. The Forum successfully provided a productive platform for experts, scholars, industry professionals, and policymakers to strengthen communication for consensus and promote future cooperation between China and India.
Young Conservatives Series – A Talk with Shri Ashok Malik
India Foundation organised the 2nd session of Young Conservatives Series on 20 June, 2024 in New Delhi. The session was addressed by Shri Ashok Malik, Partner & Chair of India Practice, The Asia Group, on the theme ‘Global Conservatism: What can we learn from it?’
Counter Radicalisation Strategy for Uttar Pradesh
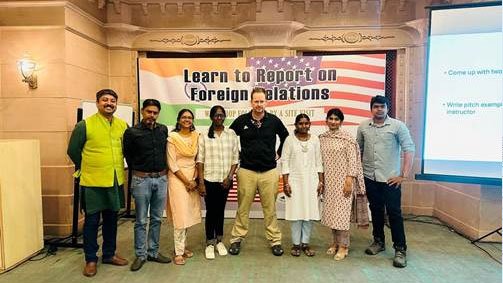
Emerging Journalist Media Workshop
Pacific Forum, in partnership with India Foundation and supported by the U.S. Embassy India, conducted the second edition of the Emerging Journalist Media Workshop in Chennai, Tamil Nadu on 14-15 June, 2024.
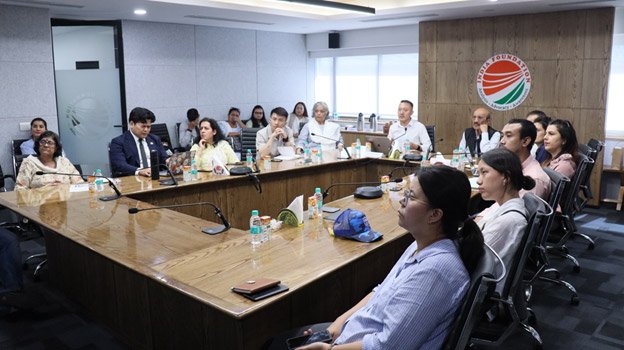
Tibet Talks – 6 – Dams and Displacement: China’s Disruptive Development Drive in Tibet
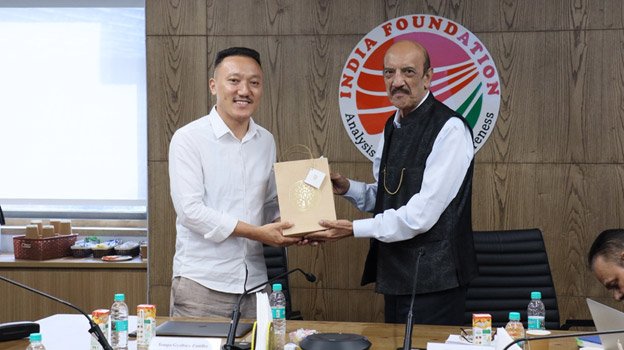
India Foundation organised the sixth session of the Round-Table Discussions in the ongoing “Tibet Talks” series. The topic for this session was “Dams and Displacement: China’s Disruptive Development Drive in Tibet”. The session was addressed by Mr.Tempa Gyaltsen Zamlha, Deputy Director of the Tibet Policy Institute. The Round-Table Discussion took place on 13 June 2024 (Thursday) at the India Foundation office, with the session chaired by Maj. Gen. Dhruv Katoch, Director, India Foundation.
The speaker addressed the session by introducing the gathering to the protests that were recently held in February, in the Derge region of Eastern Tibet, Sichuan. These protests were held due to the proposed building of the Kamtok dam in the Derge region of Tibet and hence the protesters pleaded with the Chinese government to not build these dams due to multiple risks that surrounded it. Irrespective of this, the Chinese government have planned to build 13 dams in very close proximity to each other, which according to the Tibetans will lead to multiple risks like displacement of communities, loss of culture, environmental threats, threat to human life and many more for the Tibetan communities that live near these dams.
The speaker subsequently highlighted the 10-point call put forward by Tibetan experts on the current Chinese dam construction and forced displacement in Derge which included suggestions like local inclusivity, participation of local communities in decision-making etc. However, the Chinese government has justified the rapid development of dams by attempts at decreasing poverty, optimizing energy structure and achievement of ‘dual carbon’ goals which come under the aim of achieving a ‘Moderately Prosperous Country’ for the Chinese community and hence also put a lot of emphasis on their goal of achieving peak Carbon Emission before 2030 and Carbon Neutrality by 2060. To achieve this target, the Chinese government has started building multiple dams, and solar and power institutions as they conceive it to be eco-friendly and a source of renewable energy, though this idea of dams has been contested in recent times due to manifold consequences which encompass the domains of cultural, environmental and social losses.
The discussion then delved into the Tibetan view of these rapid development of dams who perceive it to be for the Chinese people and their government and not for the welfare of the Tibetans. They believe that the construction of these dams is against the culture and heritage of the Tibetan people. The speech then furthered onto the discussion of the Bolo landslide of 2018, wherein the Jinsha river was blocked for 11 days which made the river flow backwards, leading to subsequent flooding that submerged the whole of Bolo town and destroyed more than 100 houses. The risk extended not only to the Tibetan people, but also to the various Chinese communities that lived downstream. The speaker shed light on the massive damage that can happen if such a case happens with any one of these dams in Tibet as well.
ANNUAL REPORT 2023
The Infodemic Dilemma: Navigating the Sea of Misinformation and Deepfakes
Book Discussion on ‘Gwadar: A Chinese Gibraltar’ by Capt Alok Bansal

India Foundation in collaboration with India Habitat Centre, organised a book discussion on ‘Gwadar: A Chinese Gibraltar’, authored by Capt Alok Bansal, Director, India Foundation on 06 June, 2024 in New Delhi. The session was chaired by Shri Tilak Devasher, Member, National Security Advisory Board (NSAB). Lt Gen Syed Ata Hasnain, Member, National Disaster Management Authority (NDMA), and Dr Ashok Behuria, Coordinator, South Asia Centre & Senior Fellow, MP-IDSA, delivered their remarks as the discussants for the session.
7th Ideas Series

India Foundation organised a book discussion as a part of its 7th Ideas Series on ‘Transformation: Emergence of Bangladesh and Evolution of India-Bangladesh Ties’, authored by Shri Pinak Chakravarty, former High Commissioner of India to Bangladesh, and former Secretary (Economic Relations), Ministry of External Affairs, Government of India, on 30 May, 2024. The session was chaired by Ms Rami Niranjan Desai, Distinguished Fellow, India Foundation.
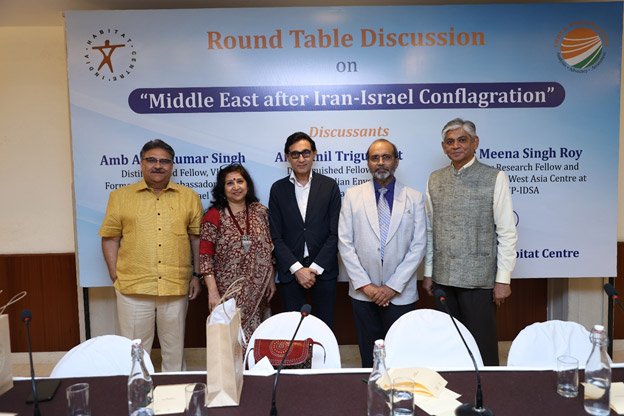
Roundtable Discussion on ‘Middle East after Iran-Israel Conflagration’
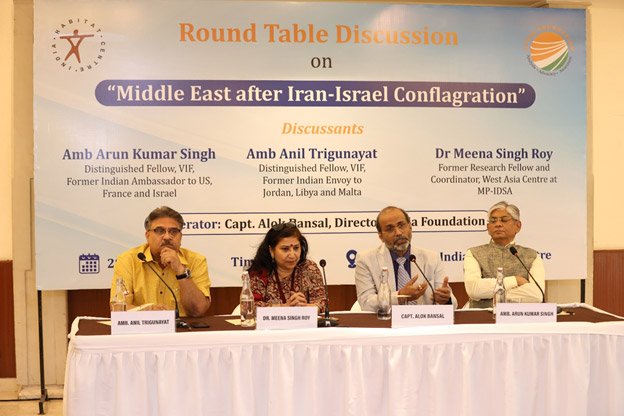
India Foundation, in collaboration with India Habitat Centre, organised a Roundtable Discussion on ‘Middle East after Iran-Israel Conflagration‘ on Tuesday, May 28, 2024, at Juniper Hall, India Habitat Centre. The roundtable began with initial remarks by the moderator of the discussion, Captain Alok Bansal, Director, India Foundation. The session was followed by the remarks of the three panelists. After the remarks by each panelist, the programme concluded with a free-flowing Q&A session and a discussion.
The first panelist, Ambassador Arun Kumar Singh, Distinguished Fellow, VIF, and India’s former Ambassador to the US, France and Israel argued about the difficulties faced by Israel in achieving its stated goal of eliminating Hamas. He drew its parallel with the US’s efforts in Afghanistan to wipe out Al-Qaeda. He highlighted that notwithstanding the popular perception that the US is a declining power, it still remains a dominant power in the region of West Asia/Middle East and China and Russia, despite being very active in undermining the power of the US, still lag behind it. Amb Singh concluded by remarking that Israel, which followed the ‘doctrine of periphery’ in the initial decades of its establishment, has since 2000 started focusing on building its relationship with the Arab world, with the Abraham Accord as an example of it.
The second panelist, Dr. Meena Singh Roy, Former Research Fellow and Coordinator, West Asia Centre at MP-IDSA began her remarks that the region of Middle East and North Africa (MENA) has always surprised scholars in many things, like what happened in Tunisia and Egypt. She mentioned the need for deeper research as to why negotiations about peace in the region have always failed. Most of the monarchs in the region, according to Dr Roy, have bought peace and established a new social contract. She also highlighted that the issue of food and water security would be a bigger challenge for the region in the future. She concluded that although at the regional level, there are many conflicts in the Middle East, yet there is a movement for greater regional dialogue, like that between Iran and Saudi Arabia.
The third panelist, Ambassador Anil Trigunayat, Distinguished Fellow, VIF, and India’s former envoy to Jordan, Libya and Malta, spoke about the attack on Israel by Hamas on 7th October. He emphasised that it was both about the loss of its people as well as about the loss of the perception of its infallibility. He pointed out that it must not be forgotten that the basic cause of the problem in the Middle East is the absence of any solution to the Palestinian issue. He also argued that there are no protests in the Arab world like those happening in US universities because the Arab leaders do not want a repeat of the Arab Spring and this attack has recharged Arab streets like never before. Amb Trigunayat concluded by stating that Middle Eastern states have indulged themselves in smart diplomacy and have started focusing on the countries of the East like China, India and Korea. The discussion concluded with the final remarks of the moderator Captain Alok Bansal, who gave an interesting insight about how the Arab streets remain anti-US, while their governments remain pro-US, which is diametrically opposite to the case of Iran, where although the regime remains staunchly anti-US, the people remain otherwise.

Condolence Meet for Shri Sushil Modi
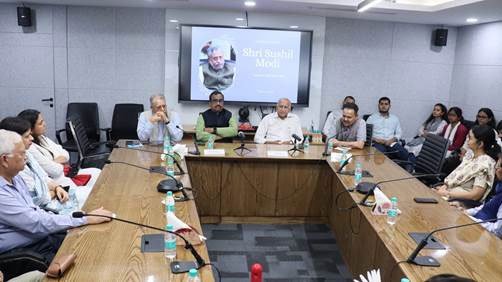
India Foundation held a condolence meeting for Shri Sushil Modion 24 May, 2024, who was a Member of the Governing Council of India Foundation. The gathering paid floral tributes to the great statesman, and shared their reminiscences about him.
3rd Shakti Sinha Memorial Lecture

India Foundation organised the 3rd Shakti Sinha Memorial Lecture on”The Future of SAARC”, delivered by H. E. Golam Sarwar, Secretary General, SAARC, on 13 May, 2024. The session was chaired by Dr Ram Madhav, President, India Foundation.